Creating a 3D Contamination Map of Fukushima Nuclear Disaster Site
The Japan Atomic Energy Agency (JAEA) successfully developed a way to 3D scan and visualize the radiation data from the 2011 Fukushima nuclear disaster by combining a Compton camera, radiation meter and Kaarta Stencil 2 mobile mapping system.
The Fukushima disaster in 2011 was the worst nuclear accident since the Chernobyl accident in 1986. All three reactor units had core meltdowns resulting from loss of coolant and generator failure to run the pumps. There were breaches, hydrogen explosions and other incidents. Since then there have been ongoing efforts to decontaminate the three nuclear reactors located at the site. This decommissioning work is anticipated to last for decades.
Rapid creation of 3D radiation maps
In the decommissioning work, it is critical to understand radiation distribution to effectively reduce radiation exposure and decontaminate the area. Contaminated areas must be identified in three-dimensions to accurately understand the distribution. The main problem is that conventional methods such as radiation meters or gamma cameras provide only point or surface measurements. It is very difficult to understand pollution distribution in three dimensions from such discrete measurements due to measurement time required and low data density.
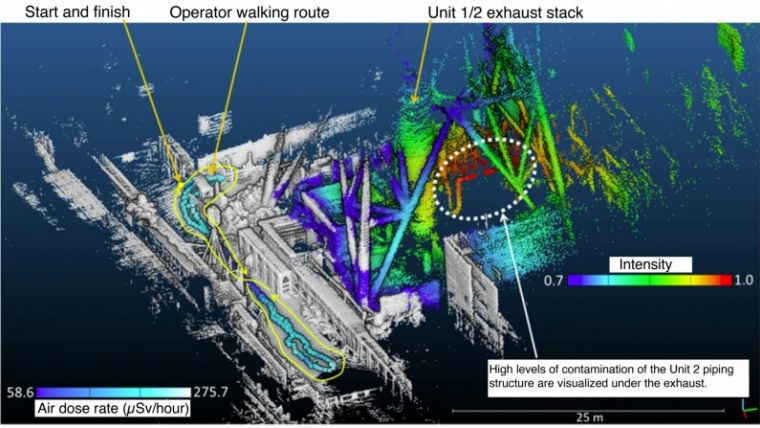
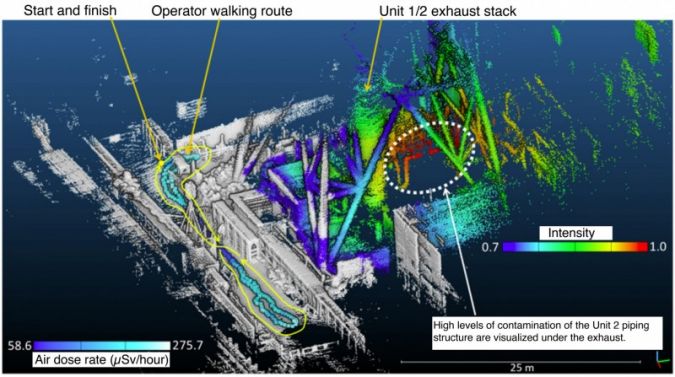
To solve this problem Japan Atomic Energy Agency (JAEA) developed a way to visualize contaminated areas and air dose rates by combining a Compton radiation camera and Kaarta Stencil 2, a three-dimensional portable mapping system. The system, called iRIS, enables rapid creation of 3D radiation maps. JAEA was able to acquire the date for visualizing the contamination distribution near the Unit 1/2 exhaust stack of the Fukushima Daiichi Nuclear Power Station as well as the dose rate distribution on the trajectory – the walking route – in a very short time, less than 5 minutes, without approaching the contaminated area.
With this approach, three-dimensional pollution distribution and dose rate distribution can be easily visualized. It is then possible to simulate the shielding and decontamination effects for reducing the dose rate. JAEA is planning to provide Tokyo Electric Power Company Holdings, Incorporated (TEPCO) and other companies with this information to plan decommissioning activities and to reduce decommissioning worker exposure within the Fukushima plant.

Value staying current with geomatics?
Stay on the map with our expertly curated newsletters.
We provide educational insights, industry updates, and inspiring stories to help you learn, grow, and reach your full potential in your field. Don't miss out - subscribe today and ensure you're always informed, educated, and inspired.
Choose your newsletter(s)


