Mapping Liquid Water on Mars
To tie in with NASA’s recent announcement about the discovery of liquid water on Mars, Esri has put together an interactive story map showing the craters and canyons on Mars that reveal evidence of water. Watch animations of the recurring slope lineae (water stains) across four different craters and explore satellite imagery and elevation data for the 'Red Planet'.
Using an imaging spectrometer on MRO, researchers detected signatures of hydrated minerals on slopes where mysterious streaks are seen on the Red Planet. These darkish streaks appear to ebb and flow over time. They darken and appear to flow down steep slopes during warm seasons, and then fade in cooler seasons. They appear in several locations on Mars when temperatures are above minus 10 degrees Fahrenheit (minus 23 degrees Celsius), and disappear at colder times.
According to John Grunsfeld, astronaut and associate administrator of NASA’s Science Mission Directorate in Washington, it appears to confirm that water - albeit briny - is flowing on the surface of Mars.
Subsurface Flow
The downhill flows, known as recurring slope lineae (RSL), often have been described as possibly related to liquid water. The new findings of hydrated salts on the slopes point to what that relationship may be to these dark features. The hydrated salts would lower the freezing point of a liquid brine, just as salt on roads here on Earth causes ice and snow to melt more rapidly. Scientists say it’s likely a shallow subsurface flow, with enough water wicking to the surface to explain the darkening.
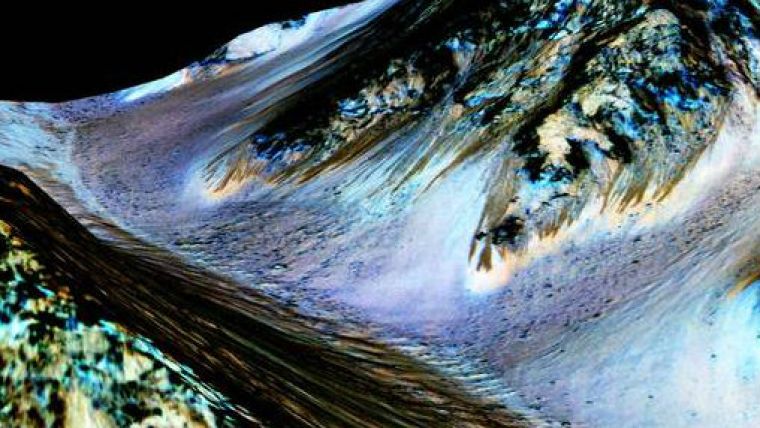
Image: Dark, narrow, 100m-long streaks called recurring slope lineae flowing downhill on Mars are inferred to have been formed by contemporary flowing water. The blue colour seen upslope of the dark streaks are thought to be from the presence of the mineral pyroxene. The image is produced by draping an orthorectified (Infrared-Red-Blue/Green(IRB)) false colour image (ESP_030570_1440) on a Digital Terrain Model (DTM) of the same site produced by High Resolution Imaging Science Experiment (University of Arizona). Vertical exaggeration is 1.5. Image courtesy: NASA/JPL/University of Arizona.

Value staying current with geomatics?
Stay on the map with our expertly curated newsletters.
We provide educational insights, industry updates, and inspiring stories to help you learn, grow, and reach your full potential in your field. Don't miss out - subscribe today and ensure you're always informed, educated, and inspired.
Choose your newsletter(s)


