New 3D subsurface tools available in Golden Software's Surfer package
Golden Software's Surfer has been enhanced with subsurface visualization and modelling capabilities. The latest release of this well-known surface mapping software features several true 3D gridding and visualization tools.
The new functionality literally adds a new dimension to Surfer’s gridding, mapping and visualization capabilities. Users can now model a fourth 'C' variable, such as contaminant or chemical concentration, along with the traditional X, Y, Z values.
“Surfer users can visualize their 3D datasets more accurately and extract richer information from them,” said Kari Dickenson, Surfer product manager. “This is extremely useful for geologists, geophysicists, hydrologists and environmental engineers to visualize subsurface conditions around drillholes and in water tables, contamination plumes and hydrocarbon reservoirs.”
Equipped with fast and powerful contouring algorithms, Surfer has been relied upon for the past 40 years to easily visualize, analyse and interpret complex datasets. It is used by more than 100,000 professionals worldwide, many involved in environmental services, engineering consulting, oil & gas exploration, mining and geospatial projects.
3D gridding and visualization tools
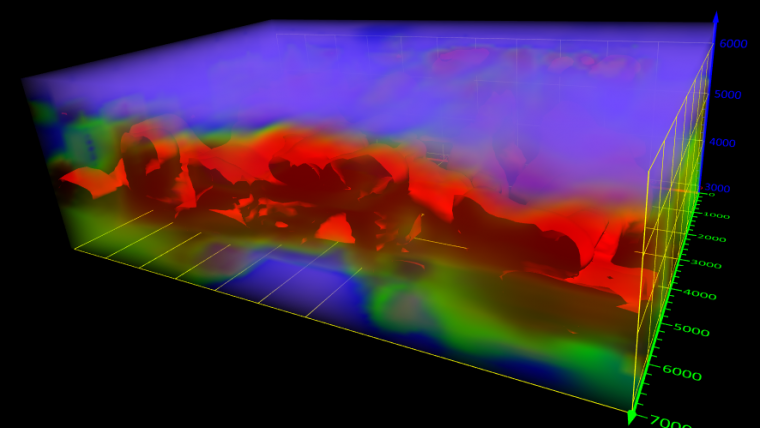
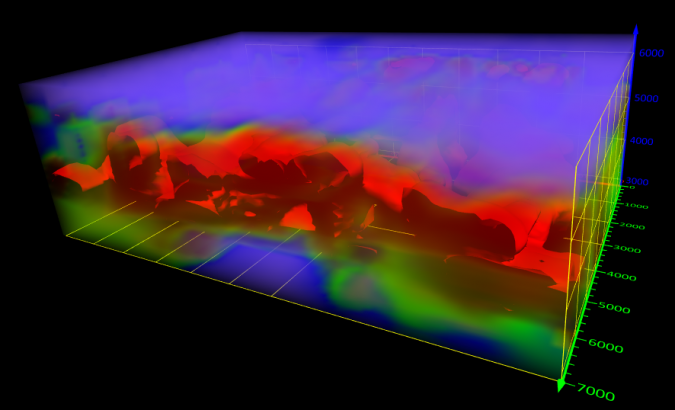
Golden Software's latest release of Surfer includes several advanced 3D gridding and visualization tools. With these tools, users can create 3D grids from data with X, Y, Z, and an additional 'C' variable, such as groundwater or soil contaminant concentration. This allows users to visualize how the concentration or another variable changes over an area with depth or elevation. Additionally, users can create a 2D map of a slice through a 3D grid and move the slice up and down, demonstrating how the 'C' value changes with depth.
The 3D grid can also be visualized as a solid body by assigning colours to different 'C values, highlighting variations in the data. Colours can be fully or partially transparent, so other surfaces or details remain visible. Alternatively, users can visualize the 3D grid as an isosurface, a surface of constant value in a three-dimensional volume, which provides another way to visualize how 'C' data varies with depth or elevation. With this tool, users can calculate the volume on either side of the isosurface value.
As is the tradition, Golden Software has released a Beta version of Surfer simultaneously with the new version to give customers a chance to try out new features while they are still in development.

Value staying current with geomatics?
Stay on the map with our expertly curated newsletters.
We provide educational insights, industry updates, and inspiring stories to help you learn, grow, and reach your full potential in your field. Don't miss out - subscribe today and ensure you're always informed, educated, and inspired.
Choose your newsletter(s)


