The Role of Geoinformation in Combating Coronavirus
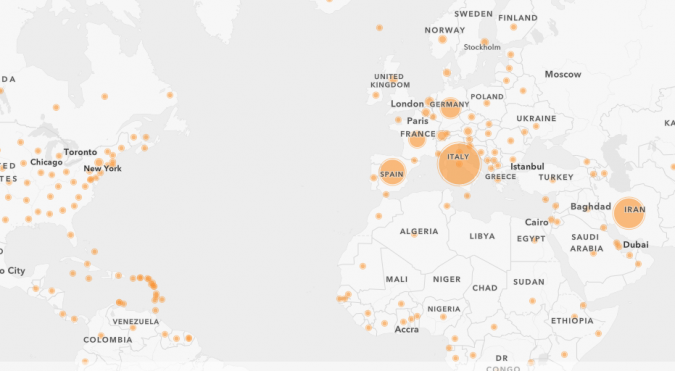
Numerous countries are in lockdown, governments have issued severe travel restrictions, companies have closed their offices… it is clear that the worldwide coronavirus outbreak is having a huge impact on our daily lives. Over the coming weeks, 'GIM International' will be zooming in on the role geoinformation and the geospatial industry can play in mapping how the outbreak is developing, and also potentially in combating the pandemic. As is often the case, a picture speaks a thousand words. Here, we present a series of maps from the Esri StoryMap team, visualizing the latest developments concerning the spread of the virus.
The maps and charts in Esri’s StoryMap are updated daily, providing an overview of confirmed and presumed coronavirus cases based on statistics compiled by Johns Hopkins University. The StoryMap also puts the coronavirus outbreak in context in relation to previous epidemics such as MERS and SARS. “Current figures indicate that the novel coronavirus is significantly less virulent than its relatives. Although the ongoing outbreak has led to over 7,000 deaths – nearly five times as many as SARS and MERS combined – its global fatality rate is around 4 percent; in comparison, the fatality rate for SARS was around 10 percent, and the rate for MERS was around 35 percent.”
How the coronavirus spread
The coronavirus outbreak began in December 2019 in Wuhan, the capital of Hubei Province and the largest city in central China with a population of around 11 million. Epidemiologists have traced the likely source of the outbreak to the Huanan Seafood Wholesale Market in downtown Wuhan, where they believe the virus was initially transmitted from animals to humans. The comprehensive and highly informative storymap as composed by Esri contains aerial imagery of the market in Wuhan.
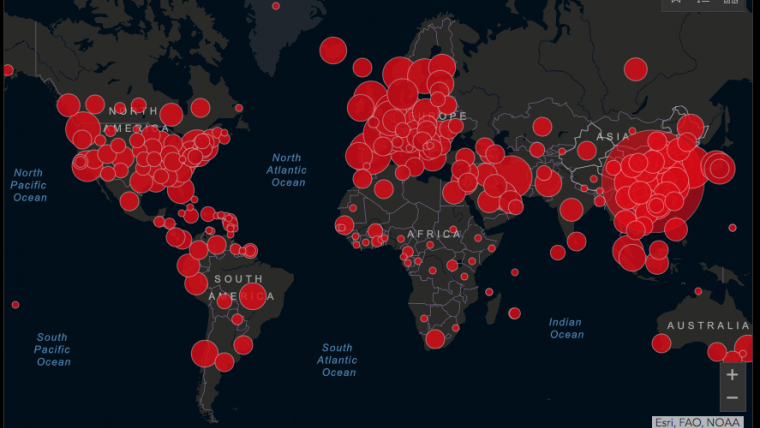
Dashboard of coronavirus spread around the globe
The latest statistics on coronavirus cases and facilities worldwide is displayed in the dashboard offered by the Center for Systems Science and Engineering (CSSE) at Johns Hopkins University (JHU). The dashboard is free accessible here.
“It is important to know how to distinguish between the advice and information coming from public health authorities and scientists, versus the misinformation that is instigating unnecessary fear,” says Lauren Gardner, an epidemiologist at Johns Hopkins University who is tracking the spread of the outbreak.
Geoinformation derived from reliable and accurate geospatial data is a vital source for authorities, in addition to all the scientifically based knowledge coming from renowned virologists and other medical experts. We can only battle the coronavirus successfully if we operate in worldwide solidarity. This message should be crystal clear to governments around the globe; now is the time to bury rivalries, because international cooperation to the fullest extent will be fundamental in overcoming this crisis.
This article is partly based on information provided by Esri.

Value staying current with geomatics?
Stay on the map with our expertly curated newsletters.
We provide educational insights, industry updates, and inspiring stories to help you learn, grow, and reach your full potential in your field. Don't miss out - subscribe today and ensure you're always informed, educated, and inspired.
Choose your newsletter(s)


