Interactive Esri Map Shows Causes and Effects of Climate Change
Esri has released an interactive map illustrating the Earth's natural and human systems and how they have changed – and will change – over time. With the 'Atlas for a Changing Planet' Story Map, scientists, policymakers, planners and activists can examine detailed spatial information that is critical for adapting to a warmer future.
Mitigating the effects of climate change is a global, geographic challenge, said Jack Dangermond, president of Esri. Understanding how the Earth's systems interact and transform is an essential first step in measuring the threat of climate change and making informed decisions to reduce it.
Atlas for a Changing Planet explores a sample of maps, imagery and data from Esri ArcGIS Online. The Story Map covers five themes: understanding natural systems, mapping human systems, mapping ocean impacts, predicting the future, and international cooperation.
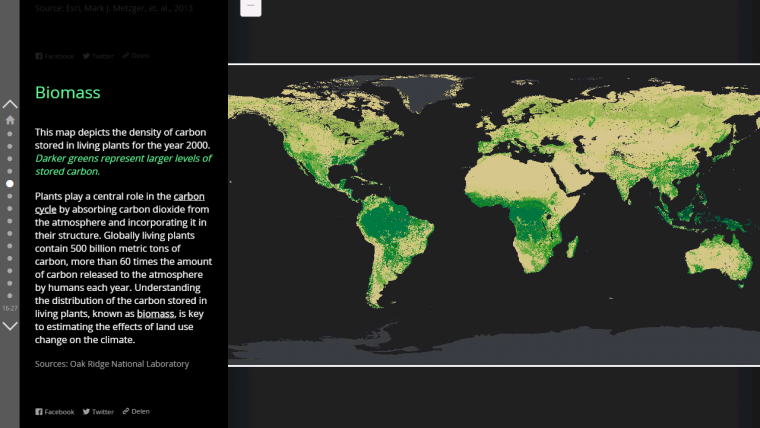
Biomass
Complex issues, processes and concepts – such as biomass and ocean acidification – are clearly and succinctly explained with maps and multimedia. For example, users visualise the density of carbon stored in living plants (biomass) with an explanation of how this information is key to estimating how land-use change affects the climate. Interactive maps illustrate which areas will be severely affected by rising sea levels, the changes in sea ice extents in the Arctic Ocean, and population growth in urban cities around the world.
The Story Map also models data from the National Center for Atmospheric Research (NCAR) in three scenarios. With this data, users navigate the Story Map to see projected changes in temperature and precipitation based on the level at which greenhouse gas emissions increase or decrease over time.
Esri created the Story Map in time for the start of the United Nations 21st Conference of the Parties (COP21). World leaders are gathering at the annual meeting to negotiate an international agreement with the goal of keeping global warming's increase below 2 degrees Celsius.
See the Atlas for a Changing Planet Story Map at esriurl.com/AtlasForAChangingPlanet. For more information on Esri Story Map, visit esri.com/storymaps.

Value staying current with geomatics?
Stay on the map with our expertly curated newsletters.
We provide educational insights, industry updates, and inspiring stories to help you learn, grow, and reach your full potential in your field. Don't miss out - subscribe today and ensure you're always informed, educated, and inspired.
Choose your newsletter(s)


