Colourized point clouds from photogrammetry
Adding value as an alternative deliverable
Since the explosion of Lidar over the past two decades, the use of point clouds in aerial mapping applications has become common these days. However, Lidar is not without its challenges. This article explores how colourized point clouds from photogrammetry can offer a value-adding alternative.
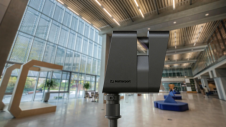
The three main challenges associated with the use of Lidar in aerial mapping have always been the cost of the sensors, the learning curve required to produce accurate datasets, and what to do with all those points when it comes to providing a deliverable. Airborne Lidar systems and the positioning systems they mate to are mostly still very expensive. This is due to manufacturers increasing pulse rates and range to meet user demand for denser datasets, while trying to reduce the overall size and weight. In the race to stay competitive, this often leaves buyers feeling that they are the guinea pigs for these ever more complicated systems.
The fact that Lidar requires highly accurate positioning systems adds to the complexity of hiring people with the skills to process these datasets consistently at high levels of accuracy. Needless to say, the learning curve is steep, and those that are good at processing Lidar are sought after and come at a premium. There is, however, another option: photogrammetry.
Evolution of photogrammetry
Photogrammetry, the ability to make maps from overlapping imagery, has been around almost since the invention of aircraft. For a long time, it required large machines known as stereo plotters to give technicians the ability to see a scene in stereo. This allowed them to draw information representing the ground and features at a given scale. As computing power increased in the 1980s, photogrammetry went digital. Not long after, in the early 2000s, the principles of photogrammetry made it possible to forgo the stereo viewing equipment and extract an XYZ coordinate for every pixel in the image where overlap occurs. This breakthrough allowed for the generation of highly accurate point clouds without the expense of a Lidar system. However, a photogrammetrically derived point cloud has one added potential benefit: colour values at no additional.
In either case, the primary deliverable in mapping projects has remained digital elevation models (DEMs), as point clouds were just too large in file size for the average user to exploit given the lack of computing power available. With advances in computing technology including more powerful CPUs and GPUs, this is changing. In addition, many popular software packages can consume point cloud data for further processing or visualization.
Advantages of colourized point clouds
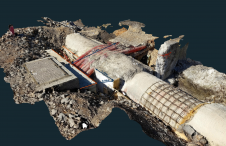
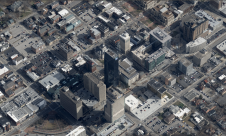
So what benefit comes from a colourized point cloud? This is easily answered by looking at an example of each. Without the added step of classification or colourization, it takes some effort to identify features hidden deep in a Lidar point cloud. In contrast, the average person can quickly identify features from a photogrammetrically derived colourized point cloud.


A point cloud created from Lidar can indeed be colourized. However, this just adds to the overall cost, with the requirement for a camera in operation when the Lidar is being acquired compromising the acquisition window or a second flight over the same area. Either method results in a longer overall acquisition time and more processing.
There are software packages that create point clouds as a derivative of the aerial triangulation process. They then generate DEMs from a decimated number of points within that point cloud. This tends to create very poor-quality DEMs in general and eliminates many of the points originally created. This also makes validation difficult for the end-users as the DEM creation is a further step removed from the aerial triangulation process.
Challenges associated with colourization
A common way of generating colourized point clouds from photogrammetry is to create a DEM, then export a point cloud from that DEM where each pixel is represented as a point. Then, using an orthomosaic, the corresponding colour value is projected straight down on each point. This works well – but only in a nadir view, because a point cloud created from a DEM in this manner does not take into consideration vertical or oblique points. As a result, vertical and oblique voids are inherent in the dataset. Where there are no points, there is no colour.
While most software tools implement this simple approach to colourization, an optimal solution is to create better associations between pixels and points. Then, however, many pixels for the same point may have slightly different colour values. That means algorithms need to calculate and merge this information. Another issue that arises is similar to the one of colour balancing in a mosaic, but here the mosaic is 3D. Advanced algorithms are thus required to do this to ensure consistency across the point cloud. Currently available photogrammetry products do not support such advanced functionalities.
Recent technology advancements
SimActive has recently introduced version 10 of its Correlator3D photogrammetry suite to allow such a colourization of point clouds. During the point cloud creation process, all pixels coming from different overlapping images (vertical and/or obliques) are first used to derive a precise 3D coordinate. Then, using advanced algorithms, Correlator3D analyses the different colour values from the associated images and calculates a final colour value. This leads to a highly realistic-looking point cloud, displaying consistent colours from all viewing angles.
The advantages of such a technology are multiple. It allows for the production of a point cloud that is similar to Lidar. Only a single data collection activity is necessary, leading to cost savings and richer deliverables. Having only one dataset to process is also quicker, easier and faster. Moreover, it guarantees that there will be no registration challenges and issues, as would be the case with merging Lidar with imagery.


The future of point clouds
As point clouds become a more common mapping deliverable, mapping professionals need to consider the end-user’s level of comfort with them. A classified point cloud certainly has value, allowing the quick identification of ground versus vegetation and so forth, but a colourized point cloud takes it to another level. For example, a classified point cloud will let the user know about the presence and location of a road sign. A colourized point cloud will add the information about what the sign says. This not only makes human interpretation easier, but also helps to advance along the path towards more machine learning and artificial intelligence (AI). Identifying real-world features through machine learning and mining valuable information from datasets via AI is already happening. How much more value can a point cloud with colour bring than one without?


Value staying current with geomatics?
Stay on the map with our expertly curated newsletters.
We provide educational insights, industry updates, and inspiring stories to help you learn, grow, and reach your full potential in your field. Don't miss out - subscribe today and ensure you're always informed, educated, and inspired.
Choose your newsletter(s)


