Comparing Lidar and Photogrammetric Point Clouds
Point Clouds for Inspecting Flood Control Structures
Airborne Lidar and photogrammetry are both viable methods for capturing point clouds for 3D modelling of man-made hard structures. Although both methods produce point clouds, the manner of capturing data differs in many ways, resulting in point clouds with differing characteristics. In this article, the author evaluates Lidar and photogrammetric point clouds captured from unmanned airborne systems for inspecting a flood control structure.
The New Orleans District of the U.S. Army Corps of Engineers (USACE) has been using small unmanned airborne systems (UASs) for land surveying, environmental monitoring, structural inspections and other applications. However, the characteristics of one UAS platform may greatly differ from those of another, and the same is true for the large variety of sensors. To identify key differences between the point clouds produced by UAS Lidar and UAS photogrammetry, a comparison has been conducted using a flood control structure as test site.
Test Site and Sensors
The flood control structure is located in central Louisiana and aims at regulating the flow of water leaving the Mississippi into the Atchafalaya River. The structure undergoes routine inspections on deformations and other damages. This study involved two types of sensors: a RIEGL VUX-1UAV lightweight airborne laser scanner and an RGB camera. The laser scanner used is compact (227 x 180 x 125mm), lightweight (3.5kg) and captures up to half a million measurements per second with an accuracy of 10mm. Mounted on a RIEGL RiCOPTER, an octocopter weighing approximately 25kg with a maximum flight endurance of 30 minutes, the field of view is 230 degrees.
Survey
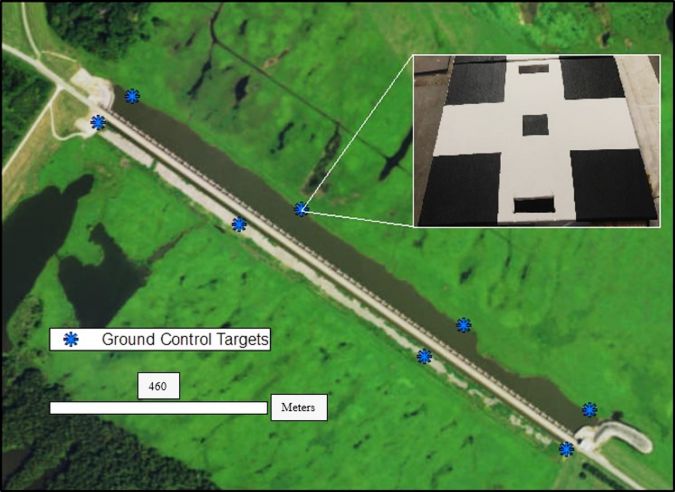
To capture images of the top of the structure, a 20Mpx G9X RGB camera was mounted on an eBee, a fixed-wing UAS with a wingspan of 96cm and a weight of 0.7kg including camera and battery. The eBee can stay in the air for up to 40 minutes. To capture images of the sides of the structure, the 38Mpx RGB built-in camera of the Albris was used. The Albris is a V-shaped quadcopter that weighs 1.77kg including the battery, payload and shrouding, and can stay in the air for up to 22 minutes. Its TripleView camera head makes it possible to switch between HD and thermal video. Both the eBee and Albris are platforms from senseFly. For georeferencing of the point clouds, eight ground control points (GCPs) were placed: four on either side of the structure (Figure 1). The GCP targets were placed prior to flight and surveyed with a Trimble R10 real-time kinematic (RTK) GNSS receiver at 180 epoch observations per GCP.
Processing
The determination of a point cloud from overlapping images requires the use of image matching algorithms. The photogrammetric processing software used was Pix4D. The ground sampling distance (GSD) was set at 3.5cm for the images acquired with the eBee and just slightly less for the Albris. This small GSD resulted in a dense point cloud. The images of the top of the structure acquired by the eBee and the images of the sides of the structure captured with the Albris were processed together in the same Pix4D project, each using the same GCPs. The resulting photogrammetric point cloud captures the entire flood control structure.
Comparison
The point clouds have been compared with respect to density, point spacing, number of points and positional precision as well as standard deviation, minimum, maximum and average of the X, Y and Z coordinates. The latter makes it possible to check whether the Lidar point cloud and the photogrammetric point cloud cover the same space. The photogrammetric point cloud has a density of 178 points/m2 while this value is 135 for Lidar. The spacing of the photogrammetric points is 3.6cm, and 4.6cm for Lidar. The photogrammetric point cloud consists of slightly over 13 million points, and for the Lidar point cloud this number is nearly ten million. The horizontal extent is very similar for both point clouds (Tables 1 and 2), showing that the two point clouds cover approximately the same horizontal plane. The Z coordinate shows how well the two point clouds align vertically (Table 3). The difference of the minimum Z values is 1.18m. Because of the water that runs along the length of the structure, the photogrammetric point cloud contains many spurious points along the bottom of the structure. While both point clouds successfully capture the bottom edge of the structure, points along the bottom have been removed from the photogrammetric point cloud during data cleaning, explaining the difference in the minimum Z values. The difference of the maximum Z values (0.28m) is caused by the fact that the photogrammetric point cloud does not cover the entirety of the guard rail that runs along the structure, whereas the Lidar point cloud does.
|
Min X (m) |
Max X (m) |
Mean X (m) |
StdDev X (m) |
|
|
Photogrammetric |
973,427.568 |
974,311.698 |
973,877.075 |
250.23 |
|
Lidar |
973,427.281 |
974,311.299 |
973,863.200 |
253.05 |
Table 1: Minimum, maximum, mean and standard deviation of the X coordinate.
|
Min Y (m) |
Max Y (m) |
Mean Y (m) |
StdDev Y (m) |
|
|
Photogrammetric |
285,965.618 |
286,592.583 |
286,268.455 |
174.16 |
|
Lidar |
285,964.996 |
286,592.579 |
286,281.644 |
177.28 |
Table 2: Minimum, maximum, mean and standard deviation of the Y coordinate.
|
Min Z (m) |
Max Z (m) |
Mean Z (m) |
StdDev Z (m) |
|
|
Photogrammetric |
12.60 |
23.13 |
20.04 |
2.59 |
|
Lidar |
13.78 |
23.41 |
21.26 |
2.07 |
Table 3: Minimum, maximum, mean and standard deviation of the Z coordinate.
Visual Inspection
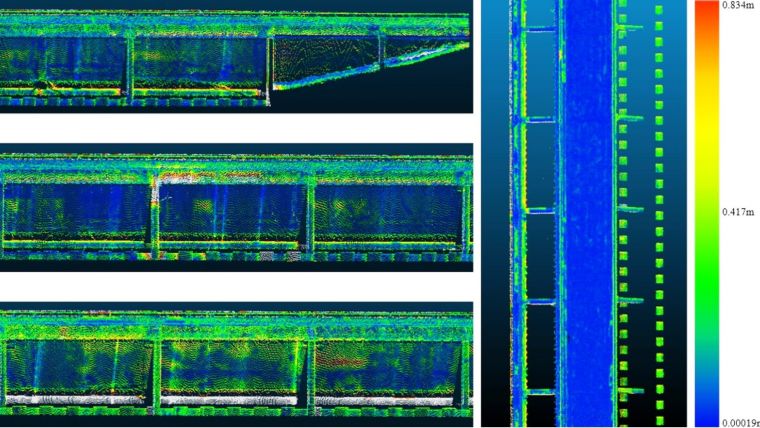
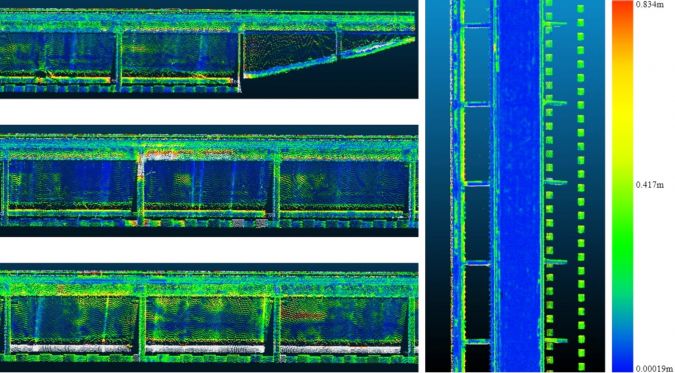
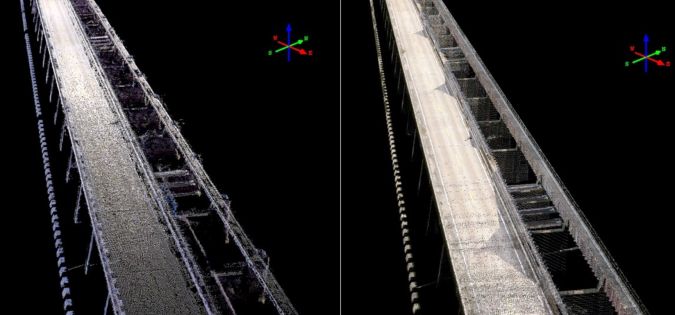
To determine how well the two point clouds align spatially, the Cloud-to-Cloud Distance tool from CloudCompare was used. The tool takes a compared point cloud and a reference point cloud and determines the nearest neighbour distance between the two. These distances are visualised by a colourised point cloud. The shortest distance (Figure 2) is 0.2mm while the greatest is 6.5m. Nearly 95% of the distances are between 0.2mm and 0.8m while 0.0106% of the distances are in the range between 5.7m and 6.5m. The deck of the structure shows the tightest spatial agreement between both point clouds with most distances smaller than 15cm. Visual inspection shows that the Lidar point cloud has less noise and clutter, displaying cleaner surfaces along the deck and piers, with sharper edges. These are characteristics which make it easier to take precise measurements, create a 3D mesh or interpolate a digital surface model. The raw photogrammetric point cloud requires extensive cleaning. The cleaning of the point cloud was done manually by clipping spurious points, and automatically by classifying misplaced points by their RGB value and removing them. The cleaning resulted in a clean model with very few spurious points (Figure 3).
Concluding Remarks
Both methods succeeded in accurately capturing the structure. The Lidar output took far less time to capture and process and provided a clean and sharp point cloud that was easy to work with. A Lidar scanner is an active sensor, and thus insensitive to the surrounding water and able to measure surfaces within the structure. The photogrammetric data collection and processing took slightly longer and the point cloud required extensive cleaning. Photogrammetric processing relies on identifiable features to be matched across sequences of images. Because the surface of water is void of identifiable features, photogrammetric processing will fail in these areas, resulting in gaps and sometimes spurious points that extend well above and below the water body’s extent. Removing these misplaced points can be time-consuming and difficult. The misplaced water body point’s RGB values could be discriminated and removed from the point cloud using CloudCompare software.

Value staying current with geomatics?
Stay on the map with our expertly curated newsletters.
We provide educational insights, industry updates, and inspiring stories to help you learn, grow, and reach your full potential in your field. Don't miss out - subscribe today and ensure you're always informed, educated, and inspired.
Choose your newsletter(s)


