Developing the digital sub-surface model for Crossrail 2
Unlocking the value of spatial data in a congested sub-terranean environment
A 3D geological model has helped to save valuable time and millions of pounds for the Crossrail 2 railway project in London, UK, by identifying geological hazards along the route and informing the tunnel alignment at and between stations.
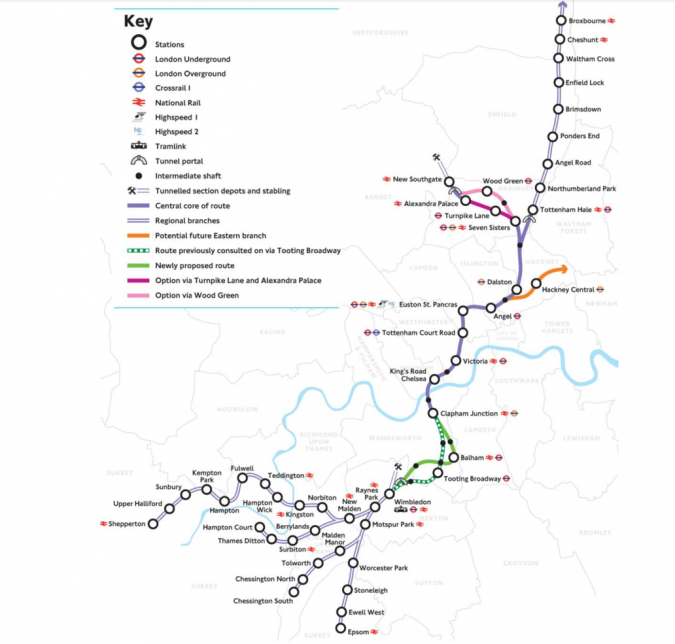
The Crossrail 2 project is a proposed £30 billion railway line through 27km-long tunnels beneath London, UK (Figure 1). Developed early in the design process, the model identified geological hazards along the route and informed the tunnel alignment at and between stations. Targeted detailed studies reduced uncertainty in critical areas in advance of project-specific ground investigations. An automated tunnelling obstructions risk assessment incorporated the ground model to estimate building foundation depths for over 30,000 buildings along the route. This was key to reducing the risk of obstructions and informing alignment optioneering in a congested subterranean environment.
Geology in the London Basin is reasonably well understood. The bedrock in London is considered to comprise the Chalk Group beneath Thanet Sand, Lambeth Group, Harwich Formation and London Clay. Overlying Quaternary deposits present along the Crossrail 2 alignment include alluvium, head, brick earth and river terrace deposits. The London Basin is a broad, northeast to southwest-trending syncline with associated smaller folds, formed during the Paleogene (approx. 66-23 Mya) around the same time as the reactivation of deep-seated basement faults, resulting in outcrops of the deeper stratigraphy and fault blocks.
Faulting and other geohazards are increasingly well documented, but continue to create headaches for construction projects in London. For example, flint bands in the Chalk wear down the cutting tools on tunnel boring machines (TBMs), slowing progress due to increased maintenance. This resulted in alignment changes to Crossrail 1 to avoid them. Water-bearing sand channels and hard bands in the Lambeth Group present challenges to non-TBM tunnelling such as cross-passages and station enlargements. Deep drift-filled hollows have caused delays and safety risks to projects including the Thames Water Ring Main (Newman 2009) and Crossrail 1 due to sudden depressions in the London Clay surface.
Developing the ground model
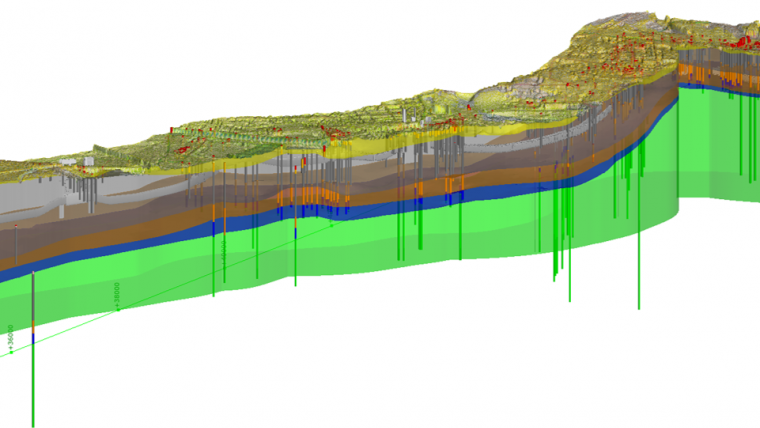
The 1:50,000 scale 3D model of the London Basin by the British Geological Survey (BGS) was adopted as the initial baseline. Over 1,000 boreholes were collated, together with information from existing publications such as tunnel face excavation records, to review and refine the Project Stratigraphic Model. Digital tools such as ArcGIS, FME and Leapfrog Works facilitated the efficient development, interrogation and dissemination of the approximately 40km2 model and helped to communicate geological uncertainty.
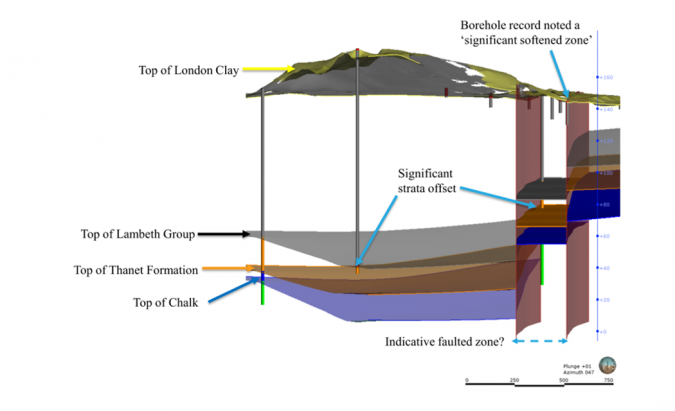
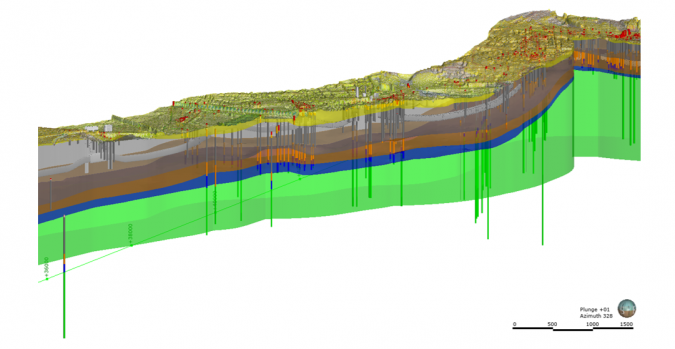
Conceptual geological understanding was key to identifying the best interpretation of the stratigraphy and geohazards, such as the alignment and characteristics of the Wimbledon Fault shown in Figure 2. Archive borehole records reporting softened zones associated with faulting helped to more accurately map the alignment in order to influence the tunnel alignment to reduce the risk of tunnelling through faulted London Clay.
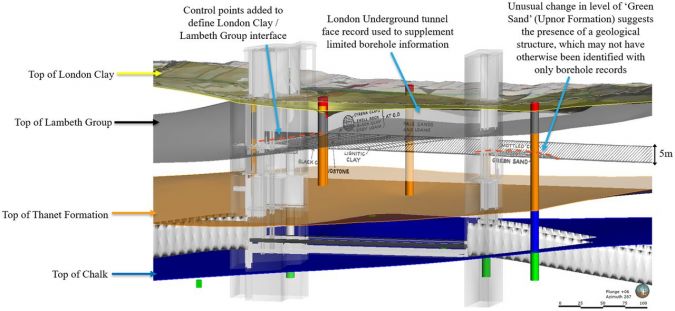
Detailed reviews of existing tunnel face excavation records from the 1930s joined the dots between archive borehole records showing sharp changes in stratigraphy across small distances (Figure 3).
Communicating model uncertainty
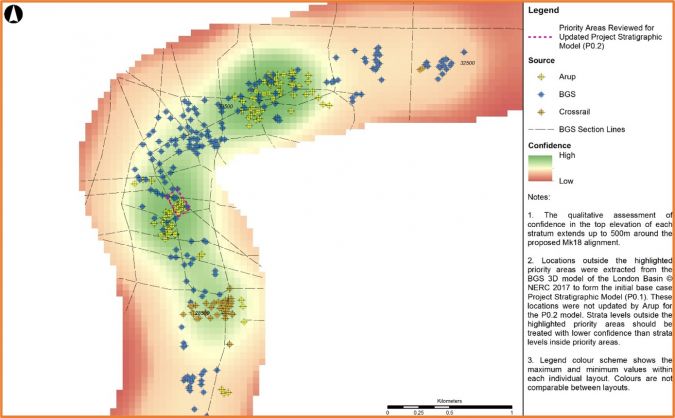
A high-level, qualitative assessment of uncertainty was undertaken to communicate the varying levels of confidence placed in each geological surface displayed in the Project Stratigraphic Model, based on the availability and quality of the data used to test and update the model. The factors considered at this stage were: the density of the control points and section lines created in GSI3D by the BGS; the existing boreholes, with relative confidence levels assigned based on the ‘reliability’ of the original; and the priority areas, where project-specific review was undertaken and the geological surfaces refined. Heat maps (Figure 4) were generated for each geological surface and overlaid with the proposed Crossrail 2 works to identify areas where further targeted review and subsequent ground investigation was required.
Informed early decision-making
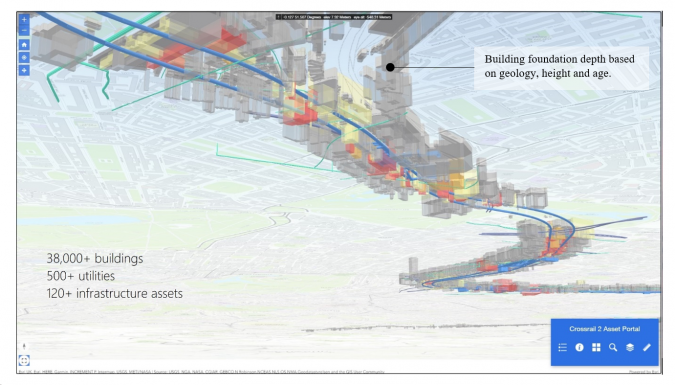
Enabling early alignment optioneering decisions required an early understanding of the key strata and geohazards. An extract from the 1:50 000 scale 3D London Basin geological model developed by the BGS was adopted as the baseline for the Project Stratigraphic Model, as it represented the best available route-wide understanding of the ground. Following the detailed reviews in critical areas, structural building information modelling (BIM) models were integrated (Figure 4) to inform the ongoing design.
Automating the production of geological longitudinal sections that were updated as the alignment changed enabled the immediate evaluation of the impact of alignment changes on the construction of these structures. This could then be rapidly fed into the decision-making process.
Station excavations through the Lambeth Group to the underlying Thanet Formation were value engineered. For example, proposed station boxes were raised or redesigned, taking account of other criteria driving the alignment, to reduce the difficulties associated with excavations in coarse-grained soil with high groundwater pressures.
Cross-passages were located where possible to avoid excavations below the base of the London Clay, where coarse-grained water-bearing horizons and other geohazards inherent with construction in the Lambeth Group would need to be considered. Where this was unavoidable, robust assumptions (e.g. on the stratigraphy) were made and the cost estimate, programme and risks were captured.
Tunnel obstructions risk
Obstructions are the main driver for the alignment design between nodes such as stations and shafts. It has always been a major challenge to undertake assessments on urban tunnel projects of the potential clash risks posed by proposed tunnel alignments to existing assets. This challenge is elevated at the early stages when alignment designs are being explored and information on assets may not be readily available to the designers. The alignment corridor of Crossrail 2 passes beneath more than 33,000 buildings and crosses hundreds of major utility and infrastructure tunnels. It would be time consuming to individually review each building along the tunnel route for each iteration of a proposed alignment and, subsequently, to manually assign a potential clash risk without delaying alignment design decisions needed to inform safeguarding and consultations with the public. Capturing thousands of individual asset information files and making them accessible and readily available to the project team required a data-centric approach. Producing plan and profile drawings to document the alignment and inform future design decisions is traditionally a laborious process. For Crossrail 1, for instance, each update of the plan and profile drawings took up to three months. This ultimately reduces the time available for designers to refine the alignment before a design freeze.
A new approach was therefore needed to perform dynamic obstruction clash risk assessments, by capturing asset information, estimate building foundation depths based on algorithms inferring local geological conditions and building data, and to facilitate the automation of drawing production.
Asset portal
For Crossrail 2, data analysts, engineers, programmers and BIM technicians developed a geospatial tool called the Asset Portal. It is a bespoke multifunctional tool that optimizes the delivery and risk management of this major infrastructure project. The Asset Portal has been designed to be used throughout the project life, from early feasibility studies and optioneering, through detailed design and into the construction period. By providing an efficient automated risk assessment of the more than 33,000 structures which may be affected by the tunnel alignment and all its evolving iterations, it reduces risk and provides a common data environment that all parties can easily access and visualize.
The tool identifies potential clashes between the tunnel and existing underground infrastructure using an automated algorithm, developed in-house by geotechnical and structural experts, to determine the notional depth of building foundations based on the height, age and Project Stratigraphic Model.
Obstruction risk assessments using the Asset Portal are far more detailed than those normally possible with the budget and resources allocated pre-hybrid bill, thus setting a new standard for de-risking the project at an early stage of the design development.
The Asset Portal was also designed to automate the production of plan and profile drawings over the >30km route. In this subsequent stage of production, asset geometry, geology and relevant data stored in the Asset Portal database is automatically plotted onto drawings with all relevant tags and information. This removes the manual process of creating these drawings, which usually occupies a team of engineers and technicians for months. As well as saving thousands of hours of labour for obstruction risk assessment, time savings of over two months were achieved by automating drawing production using the Asset Portal when compared to drawing production for Crossrail 1.
This approach resulted in more alignment changes being incorporated to improve the alignment design at an earlier stage and focused more effort on exploring improvements to the alignment for an extended period.
Conclusion
To inform early decision-making, cost estimates, programme estimates and risk assessments, a 3D geological model was developed to enable data-driven design decisions and obstructions risk assessments taken to an unprecedented level of detail on a major tunnelling project. Adjustments could be made to the tunnel alignment to avoid geohazards and potential obstructions far earlier in the design process than would typically be possible. This facilitated substantial cost savings for the project in excess of tens of millions of pounds, and substantial programme savings in the order of two years. It also reduced the risk of future changes to the alignment requiring changes to safeguarding, land take and delays due to re-submitting for powers such as development consent orders. A user-friendly geospatial portal for inputting and viewing asset information has been established as a legacy for the project.
3D geological models are now routinely developed across Arup projects, such as on High Speed 2 (HS2), and work with Seequent has been aimed at further improving the integration of Leapfrog into the design analysis workflows.
The future of managing below-ground information and risk on infrastructure projects lies in continually improving access to high-quality data and sharing dynamic insights obtained through the lifecycle of the project to enable accurate and predictive data-driven decision-making.

Value staying current with geomatics?
Stay on the map with our expertly curated newsletters.
We provide educational insights, industry updates, and inspiring stories to help you learn, grow, and reach your full potential in your field. Don't miss out - subscribe today and ensure you're always informed, educated, and inspired.
Choose your newsletter(s)


