GIS and RS in City Planning in Turkey
Open and Green Areas in Cities
The volumes of data needed for planning has made GIS an invaluable tool, now used for such purposes all over the world. Satellite images also provide rapid and up-to-date data for planning. The authors studied the use of these methods for determining the adequacy of open and green areas for sports and play in urban Eskisehir, Turkey.
Both graphic and non-graphic data was used during the study. ArcGIS and Intergraph Geo-media Pro were used to analyse the data, while the image processing was done with Image Analyst and Erdas Imagine.
Satellite Data
The satellite images used were Land TM images recorded in September 1999, resolution 30x30 metre, and IKONOS images from 2002, resolution 1x1 metre. The Landsat images were rectified and corrected for radiometric and atmospheric distortions. Map data used included Esksehir City Plans and maps of the city neighbourhoods. Other data used included:
- green-area classes provided by the Directorates of Parks and Gardens of Tepebasý, Odunpazarý and Metropolitan Municipalities.
- children’s playgrounds
- sports fields
- 2004 population data on neighbourhood basis, provided by City Health Directorate.
Since the population data was arranged according to city neighbourhoods, all other data was rearranged and reclassified on the same basis. To integrate all data within a digital environment, analogue maps were scanned.
Classification
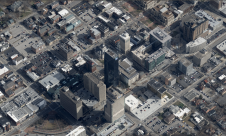
The spatial distribution of green areas was determined by three methods: vegetation index, supervised classification, and visual classification. The Normalized Vegetation Index (NDVI) is calculated per pixel as a function of the red (R: 0,62µm -7µm) and near infrared (NIR: 0,7-1,5µm) band: NDVI = (NIR – R)/(NIR+R). The DDVI value range lies between 1 and -1. The chlorophyll in plant tissues will largely absorb the red band, while NIR is largely reflected. So green areas will show a NDVI close to 1, the NDVI of bare ground will be around 0 and of water close to -1. Landsat TM images were processed using Image Analyst to obtain the NDVI. For supervised classification, sample pixel values were collected for distinguishing each class, and the minimum distance classifier was applied to Landsat TM images using Image Analyst. For the selection of sample pixel values, bands 3, 4 and 5 were coloured respectively blue, green and red, and classification was according to these choices. Since conifers show a lower reflection than herbaceous species, two main classes were assigned according to vegetative reflection values. Since the resolution of Landsat was not high enough to determine all green areas, visual classification was carried out by digitising IKONOS images to complete the mapping of green areas. Using ArcGIS, IKONOS images were also used to create 3D models for some parts of the study area.
Visual Results
After determining the adequacy of the area and distribution of green areas and playgrounds using GIS analysis tools, the results were visualised in nearly a hundred maps. For example, determining the accessibility of sports fields and playground areas was done by representing them as point features to buffer accessibility zones around these points according to age groups. Figure 4 shows an example of accessibility for age group 3-6 year-old children, with buffer zones of 30m, 70m and 150m.
Acknowledgements
Thanks are due to Prof. Dr Can Ayday and Metin Altan.

Value staying current with geomatics?
Stay on the map with our expertly curated newsletters.
We provide educational insights, industry updates, and inspiring stories to help you learn, grow, and reach your full potential in your field. Don't miss out - subscribe today and ensure you're always informed, educated, and inspired.
Choose your newsletter(s)


