GNSS, Cadastres and Drones
This article was originally published in Geomatics World.
Richard Groom summarises some of the interesting papers from the FIG Congress focussing on GNSS, Hydrography, 3D Cadastre and mapping.
GNSS – Detecting Cycle Slips
Roberts and Hancock (TS03E) presented a paper on GNSS observables in a multi-constellation and multi-frequency world. The paper starts with a useful summary of how the systems have developed. Specifically, they look at the range residual and the ionospheric residual – both of which can be used to detect cycle slips.
The range residual is the difference between the range calculated using pseudorange and the range calculated from the carrier phase on a specific frequency for consecutive epochs. It is a direct measurement of noise, because all other factors, such as ionospheric and tropospheric errors are treated as the same over the very short time interval.
For signals passing through a vacuum, the phase observations from a satellite to a receiver can be mathematically scaled to determine the equivalent phase measurement on another frequency. GNSS signals actually pass through the ionosphere and the effects of the ionosphere appear as residuals between phase which would be expected in a vacuum and the phase actually observed – known as the ionospheric residual.
The authors plot the ionospheric and range residuals for various satellites from all the constellations and the results make interesting viewing. They note that the L1, B1 and E1 signals from GPS, Beidou and Galileo are always noisier than the other frequencies and that the noise is greater at low elevations, signals from newer satellites exhibit less noise than older satellites and that even in the same constellation, some satellites produce better quality data than others.
On the same subject, Zhao et al (TS03E) describe how the triple frequency GNSS, now available, can be used to detect and correct cycle slips instantaneously by comparing the process of cycle slip detection for single, dual and triple frequency receivers. This extends the latency of fixed ambiguities, shortens the convergence time for precise point positioning and improves the positioning precision of the carrier phase. For the user, the results should mean greater reliability and higher accuracy. This method works well for satellites above 20° elevation. There is still further work to be done to detect cycle slips below this elevation.
Gao (TS04E) states that it is just a matter of time before precise GNSS enters the mass market. Mass market receivers which process carrier phase measurements are being introduced but the challenge is to reduce convergence times from tens of minutes to be almost instantaneous.
Luo et al (TS04E) goes into some detail on the means of adjusting GNSS observations when the pole is tilted. Determining the direction to north is the challenge. If an electronic compass is used it will be disturbed by local magnetic effects, so Leica’s GS18T utilises IMU measurements. By tilting the receiver, the range to satellites changes as does their elevation angle.
Hydrography
In Session TS01D, Abadallah and Schwieger test GNSS PPP (precise point positioning) for hydrographic surveys of rivers. By holding the height coordinate fixed, it is possible to improve 2D position accuracy. They achieved an RMS of 47-80mm. The constrained position is 16-35% less noisy than the unconstrained position.
As the political temperature in the South China Sea continues to rise, Abdullah (TS01D) discusses how to determine the position of the edge of the continental shelf. Under UNCLOS, this is defined as the change of gradient between the continental slope (typically 2 to 45°) and the ‘rise’ (typically less than 0.5°). He traces a line around an area known as “The Dangerous Ground”, the disputed part of the South China Sea, which is characterised by many isolated reefs, rocks and islands.
Ugwuoti et al presented a study of the effect of beam width and sea bed slope on the accuracy of bathymetry to IHO Special Order and Order 1a and 1b. They present their results in tabular form.
Best Practices 3D Cadastres
TS04C was devoted to six presentations – an introduction and then five chapters of FIG publication ‘Best Practices 3D Cadastres’. Van Oosterom’s paper provides the introduction to the five chapters on legal foundations, initial registration of parcels, 3D cadastral Information Modelling, 3D spatial DBMS and visualisation. The full document can be downloaded from www.fig.net/resources/publications/figpub/FIG_3DCad/FIG_3DCad-final.pdf
Chapter 1 starts by making the point that with the development of 3D spaces above ground, with high rise and overlapping rights restrictions and responsibilities, and underground with basements, tunnels and utilities, 2D cadastral records are no longer suitable. However, the concept of 3D varies according to the legal history of the country concerned. The chapter examines the situation in 15 countries around the world and with varied civil law backgrounds and ranging from countries which already have 3D cadastres to those where 3D has not been considered. Chapter 1 is itself a mighty work of 70 pages but pages 54 onwards compare the examples and summarises the findings.
Chapter 2 considers what is being registered. For example, it could be a physical structure, an envelope enclosing the physical 3D structure or a slice of rights above or below ground. The objective is to be authoritative, use open formats and conform to international standards for data modelling. 3D property definitions in eight countries are compared. The paper considers using sources such as BIM to produce the model.
Chapter 3 covers cadastral information modelling and the linking of rights, restrictions and responsibilities modelled using the Land Administration Domain Model (LADM) with physical reality. The authors acknowledge that land ownership boundaries and physical features are linked, and the value of taking data from existing physical models, but note that these have to be ‘as built’ as opposed to design data. They also point out the risks should the physical object move. The authors look at compatibility between Smart City, BIM and indoor data (expressed in IndoorGML) and legal boundaries. They compare the approach in five countries and wind up with some useful conclusions.
Chapter 4 addresses 3D spatial DBMS for 3D cadastres and opens with the question of ‘how to deal with point clouds as well as 3D objects’. The authors realise the value of point clouds for visualisation and for surveying physical features for reference. The authors also consider ‘voxels’, which define 3D space using gridded cubes. Data storage is an issue with this and the paper describes the ‘Parquet’ format, amongst others. Indexing is an important part of spatial data management and the article devotes plenty of space to this interesting topic followed by 3D geometries and operations. The paper then looks at how proprietary DBMS can handle 3D cadastral data. If the 59 page article is too long for most of us, the conclusions from page 49 are well worth reading.
The final chapter on visualisation comprises another 55 pages of wisdom which are well worth reading. 3D cadastres have many users and the paper considers these user groups, their needs and challenges. As in other papers, the authors stress the need to bear in mind 4D as well as 3D.
UAVs, Laser Scans and Radar
Weber and Lerch (TS02F) provide a very useful comparison of height accuracy for surveying a quarry using the Trimble SX10, which was used as ‘control’ and various configurations of UAV photogrammetry using the SenseFly eBee. Photogrammetric computations were made with the eBee’s RTK positioning facility - with and without using ground control points. This is a ‘must read’ for most of us.
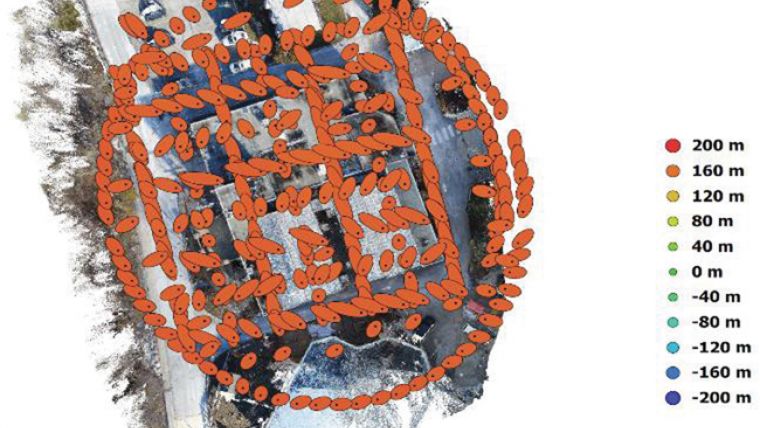
Combining terrestrial laser scanning with UAV photogrammetry for low cost surveying is the subject of Afifi and Rabbany (TS04F). The scanner was a FARO Focus S and the UAV was a DJI Phantom 4 Pro with a 20Mpx camera with 84° field of view. They flew a grid of flight lines with two circles around the perimeter of the site. There were eight ground control points and 16 verification points which revealed altitude errors between -4.8cm and +4.2cm.
Altinisik and Kavlak (TS04F) used UAV photogrammetry to survey progress in construction of a railway line in Ehtiopia. The intention was to check for setting out errors and calculate progress volumes for payment. Ground control was established at 500m intervals along the 270km long 80-340m wide corridor. A fixed-wing UAV was used carrying a Sony A6000 camera. Output from the camera was in RAW format which could then be radiometrically corrected using CaptureOne software. The photogrammetry was carried out using Pix4D. The authors go into some useful detail about construction of the DSM.
Guney et al (TS04F) established a ‘semantic mapping framework’ to enable mobile robots to act intelligently in the environment and solve tasks. They used a robot equipped with a laser scanner to explore the environment and generate mapping with semantic information. The goal is to enable robots to perform a number of tasks, including inferring nearby objects, complex navigation and path planning, and change detection. It involves recognising patterns and learning new patterns in 3D. The authors go into some detail about how the data can be represented and labelled.
Cabuk et al (TS01C) studied open source DTM data from ALOS and SRTM satellites. They compared DTMs of hilly and plain areas. They concluded that ALOS 30m resolution data gives the higher accuracy (better than 2.5m). Continuing the open data theme, Shoman et al (TS01C), related their efforts to establish an open data initiative in Turkey.
The papers can be downloaded from www.fig.net/resources/proceedings/fig_proceedings/fig2018/techprog.htm
This article was published in Geomatics World September/October 2018

Value staying current with geomatics?
Stay on the map with our expertly curated newsletters.
We provide educational insights, industry updates, and inspiring stories to help you learn, grow, and reach your full potential in your field. Don't miss out - subscribe today and ensure you're always informed, educated, and inspired.
Choose your newsletter(s)
