Micrometre-level Deformation Monitoring of a Concrete Dam
Accurate and Frequent Deformation Monitoring Using Fibre-optic Cables
Highly accurate measurements with a high temporal resolution have always been a challenge, especially for locations that are hard to reach since conventional geodetic deformation methods are often unsuitable for such locations. With fibre-optic deformation monitoring, cables can be embedded in an object and left alone to provide permanent deformation monitoring measurements. Such a system was installed in a dam in Austria to provide insight into the expansion of joints inside the dam when the reservoir level changes.
Hydroelectric power plants are an important source of energy in mountainous regions. The large reservoir lakes behind dams often create a picturesque scene, despite the fact that the dams are made of huge, vertically aligned, reinforced-concrete blocks. There are more than 160 such dams in Austria alone. However, these dams can pose a risk to the environment if structural damage occurs. Hence, deformation monitoring measurements are carried out at regular intervals to ensure dam safety. Traditionally, such measurements are taken using total stations and GNSS, whereby points are surveyed on the crest of the dam and inside the inspection corridors every three months.
In the past decades, many hydroelectric power plants have been converted into pump-storage plants. When demand for power is high the plants operate as usual, providing energy by releasing water from the reservoir lake through the turbines. During off-peak hours, low-cost electricity is used to pump water from a collection basin into the reservoir lake at high altitude, As the water can be pumped with a relatively high energy efficiency of 80%, this is an effective way of storing surplus energy during periods of low demand.
In the traditional method of operation, the water level changes slowly in line with a yearly cycle. In contrast, on-demand pumping and discharge of water leads to an increased and more erratic load cycle of the dam. This requires new monitoring techniques with greater precision and a higher temporal resolution. Using traditional survey equipment, it is not feasible to achieve a very short measurement interval cost-effectively in the harsh alpine environment. Therefore, in the case of the Kops dam in Austria, a fibre-optic monitoring system was installed to conduct permanent deformation monitoring.

Fibre-optic Monitoring
Fibre-optic sensors are a useful alternative to deformation monitoring because they can supply very high-precision measurements for hard-to-reach locations. They are based on a fibre-optic cable which is embedded into an object and can supply measurements with a frequency of several kHz.
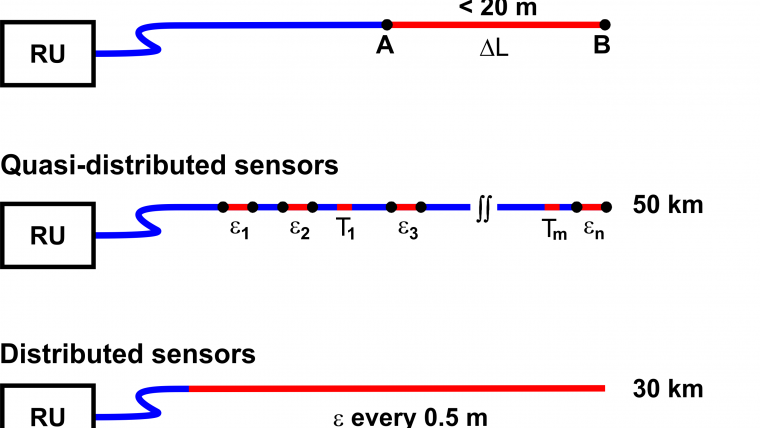
Fibre-optic measurement systems emit light into glass fibres and analyse the returning signal. The light source and the signal analyser are usually integrated in one instrument called the reading unit. There are various types of fibre-optic measurement systems (Figure 1).The simplest installation is the point sensor, which measures changes in length in the sensitive area at the end of the fibre-optic cable. In this sensitive area the signal path is split up into one stable path and one variable path. The phase difference between the returned light from both paths can be depicted by an interferometer.
Distributed Sensors
The point sensors can give a very precise reading of changes in length at one single position. With quasi-distributed fibre-optic sensors it is possible to obtain measurements at many points along the fibre-optic cable. In a quasi-distributed system, sensors are physically placed at the desired measurement locations. These systems use Fibre Bragg Gratings (FBG) which are periodic refractive index changes inscribed into the fibre. Light with the Bragg wavelength gets reflected at the position of the grating. This reflected signal can be measured with an optical spectrometer. When the length of the FBG changes, the spacing of the grid also changes and thus the reflected wavelength shifts. This wavelength shift can be measured and converted into length changes (Figure 2).

An FBG follows the deformations of the object if the cable is fixed to the monitoring object on both sides of the FBG. In this case an elongation or shortening of the distance between the fixation points results in FBG wavelength shifts which can be measured and converted into strain values (ε). Achievable accuracies are in the range of 1µε. This corresponds to 1µm if the distance between the fixation points is 1m.
Installation
The Kops dam in Vorarlberg, Austria, is a concrete arch dam with a height of 122m and a crest length of 614m. A quasi-distributed system was installed in one of the inspection corridors of the dam in the autumn of 2013 (Figure 3). 15 expansion joints were equipped with FBG sensors. To enhance the robustness of the fibre-optic sensors, the bare fibres were protected by a polyamide tube. Metal anchors at each end of the sensor ensured a rigid connection to the concrete dam and therefore the cable could be used to measure length changes of the concrete joints (Figure 4). The 15 sensors were placed on three measurement chains to cover the entire length of the dam. Thus, only three fibre-optic leading cables were required to connect all sensors to the reading unit, which was placed about 500m away from the sensors in a maintenance building beyond the dam. The reading unit took measurements automatically in a predefined interval and fed the data into the dam owner’s control software.

Measurements
Figure 5 shows the results of five sensors in the first measurement chain during a two-week time frame. It can be seen that during the first seven days the water level was almost constant. The joint deformations in the range of 15µm that were observed during that time (Figure 5-a) were therefore mainly caused by temperature changes. During the second seven days the water level increased by several metres. As a result the concrete joints were closing (Figure 5-b). It can also be seen that the same water level rise caused different degrees of deformation for different joints. A one-metre water-level increase caused block joint deformations of -1.1µm for sensor location A2 and -5.5µm for sensor location A3. Such small deformations can only be depicted due to the high precision of the fibre-optic monitoring system. Considering the precision of the FBG measurement system of 1µε and the distance of 40cm between the anchor points the concrete joint deformations can be measured with 0.4µm precision which was also verified empirically. Using the fibre-optic monitoring system, a change of the deformation behaviour of the dam can be detected immediately which is critical for early-warning systems. Furthermore, there is no need to access the dam to perform the concrete joint measurements.

Concluding Remarks
This monitoring example at a dam in Austria demonstrates the huge benefits of fibre-optic sensors. Due to their high precision, high spatial resolution and high temporal resolution, they are very suitable for monitoring purposes. As they can be embedded into structures, they also enable permanent monitoring of locations that are otherwise hard to reach. This makes them a perfect complement to conventional geodetic sensors in challenging monitoring projects. It has to be noted that, as with all sensors, thorough calibration and the compensation of adverse temperature effects are crucial to achieving highly accurate results.
Acknowledgements
Thanks are due to the funding partner of this monitoring project, Vorarlberger Illwerke AG.


Value staying current with geomatics?
Stay on the map with our expertly curated newsletters.
We provide educational insights, industry updates, and inspiring stories to help you learn, grow, and reach your full potential in your field. Don't miss out - subscribe today and ensure you're always informed, educated, and inspired.
Choose your newsletter(s)


