Read this guide to the main 3D data representation methods to understand the key differences and choose the best method for your specific applications.
The 3D data jungle in today’s computerized ecosystem – primarily populated by reality capture devices – presents forms that vary in both structure and properties. As a kind of visual guide, this article provides an overview of the main 3D data representation methods – 3D point clouds, meshes, parametric models, depth maps, RGB-D, multi-view images, voxels and more – to help users understand the main differences and choose the best method for their specific applications.
A point cloud is a set of data points in a three-dimensional coordinate system defined by X, Y, Z coordinates. Reality capture devices and techniques such as photogrammetry and Lidar usually enable the external surface to be described in its three dimensions by a generated point cloud. Point clouds are simple yet efficient 3D data representations. While fast rendering and transformations make a direct inspection of a point cloud handy, they are often not perfectly integrated into commonly used 3D applications with sophisticated functions. However, recent developments show a trend towards better support, even within pure mesh-based rendering platforms such as the Unreal 5 game engine. Still, a standard process is to derive a mesh using a suitable surface reconstruction technique.
3D models
Almost all 3D models can be divided into two categories:
Solid: These models define the volume of the object they represent. Solid models are mainly used for engineering and medical simulations and are usually built with constructive solid geometry or voxels assemblies.
Shell or boundary representations (B-Reps): These models represent the surface, i.e. the boundary of the object, not its volume. Almost all visual models used in reality capture workflows, games and film are boundary representations.
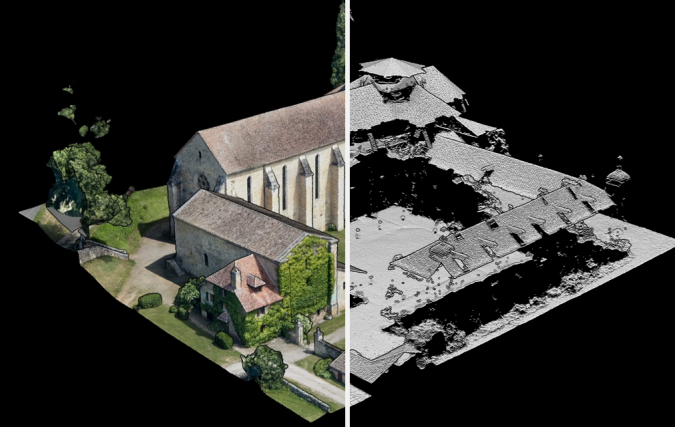
Figure 1: A 3D point cloud of an abbey acquired in 2014 using photogrammetry or Lidar.
Solid and shell modelling can create functionally identical objects. Differences between them are primarily variations in how they are created and edited, conventions of use in various fields, and differences in types of approximations between the model and reality.
3D models can describe a point cloud based on three main strategies: constructive solid geometry, implicit surfaces (+parametric modelling), and B-Reps. The most common 3D models are B-Reps such as 3D meshes.
3D mesh
A mesh is a geometric data structure that allows the representation of surface subdivisions by a set of polygons. Meshes are mainly used in computer graphics to represent surfaces, or in modelling to discretize a continuous or implicit surface. A mesh is made up of vertices (or a vertex), connected by edges making faces (or facets) of a polygonal shape. When all faces are triangles, this is called triangular meshing. Triangular meshing is most common in reality capture workflows.
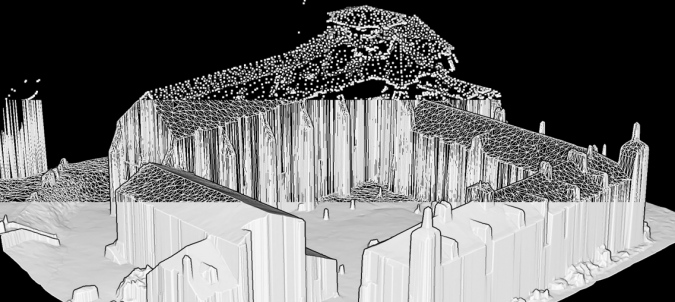
Figure 2: From top to bottom – the vertices of the mesh, the edges linking the vertices together, the faces formed by vertices and edges (primarily triangular).
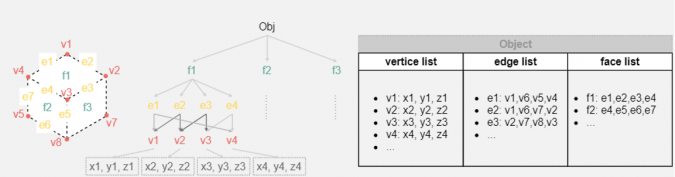
Quadrilateral meshes are often obtained through mesh optimization techniques to achieve more compact representations. These meshes are based on the boundary representation, which depends on the wire-frame model (3D lines simplify the object; a line represents each object's edge in the model). The boundary representation of 3D models is mainly composed of two parts: the topology (organization of elements) and the geometry (surfaces, curves and points). The main topological items are faces, edges and vertices. and I schematized below a simple B-Rep for a cube.
Meshes are a great way to make the geometry of a point cloud explicit, and often enable a significant reduction in the number of points needed as vertices. Besides that, they give a sense of the relationship between objects through the connectivity between the faces. However, meshing is an interpolation of the base point cloud geometry and can only represent the data to a certain degree, linked to the complexity of the mesh. There are many strategies for meshing a point cloud, but they often require users to have some theoretical background and to know which parameters to adjust for an optimal result.
Figure 3: The schematization of a simple boundary representation for a cube.
Voxel-based models
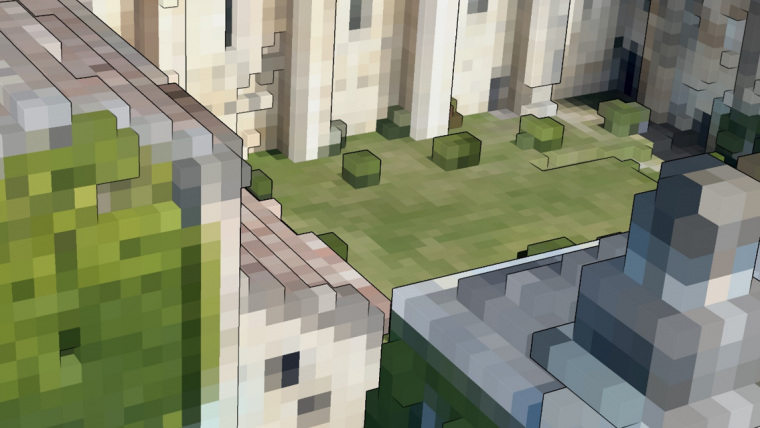
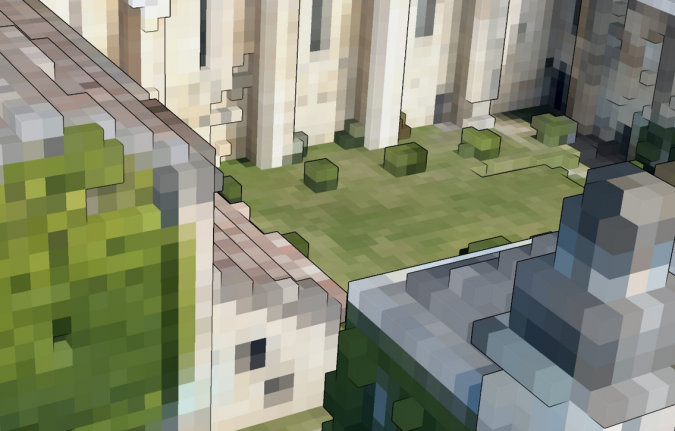
A voxel can be seen as a 3D base cubical unit that can represent 3D models. Its 2D analogy is the pixel: the smallest raster unit. A voxel-based model is a discretized assembly of ‘3D pixels’ and is most often associated with solid modelling. In the case of point cloud data, one can represent each point as a voxel of size X to obtain a ‘filled’ view of empty spaces between points. Voxels are mainly associated with data structures such as octrees and make it possible to average a certain amount of points per voxel unit, depending on the level of refinement needed (see Figure 4).
While this is practical for rendering and smooth visualization, it approximates the initial geometry coupled with aliasing artifacts and can give false information if the volume information is used incorrectly. However, the very structured grid layout of voxel models can be convenient for processing tasks such as classification through 3D convolutional neural networks.
Parametric model (CAD)
‘Parametric’ is used to describe a shape’s ability to change by setting a parameter to a targeted value that modifies the underlying geometry. This is very useful if you want to model ‘walls’ merely by setting up their orientation, length, width and height, for example. So parametric modelling is suited to using computing capabilities that can model component attributes with real-world behaviour. Parametric models use a composition of feature-based, solid and surface modelling to manipulate the model’s attributes. One of the essential features of parametric modelling is that interlinked attributes can automatically change values. In other words, parametric modelling allows the definition of entire ‘classes of shapes’, rather than just specific instances. However, this often demands the underlying point cloud geometry to be structured very smartly to break down the model entity into sub-entities (e.g. segments) aggregated in classes.
Parametric models are time-consuming to create but can add a lot of value to the 3D point cloud data, through massive semantic enrichment and additional triggers on the relations between objects constituting the scene.
Depth map
The depth map is one type of raster-based point cloud representation.
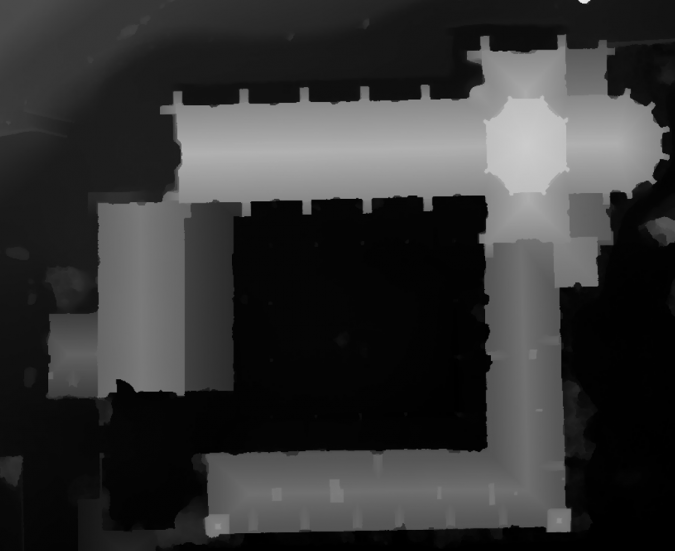
A depth map is an image or an ‘image channel’ containing information relating to the distance of the points constituting the scene from a single viewpoint. A depth image visualizes the distance of objects from the camera based on the colour of the pixels. Although most geospatial professionals are used to working with RGB images, the simplest form of expressing the depth is to colour-code intensity values on one channel, with bright pixels having the highest values and dark pixels having the lowest values.
This form of point cloud representation is sufficient if superficial information is needed linked to a known point of view. This is the case for autonomous driving scenarios, for example, in order to quickly map the environment at each position through a 360-degree projected depth map. However, the major downside is that it is only possible to work with 2.5D data rather than 3D data, since a depth map cannot represent two different values for one line of sight.
Figure 4: Example of voxel generalization based on an octree subdivision of the space occupied by the point cloud data.
RGB-D
RGB-D data provides 2.5D information about the captured 3D object by attaching 2D colour information (RGB) to the depth map. Besides being inexpensive, RGB-D enables effective representations of 3D objects for various tasks such as identity recognition, pose regression and correspondence. The number of available RGB-D datasets is vast compared to other 3D datasets such as point clouds or 3D meshes, and RGB-D is the preferred way of training deep learning models through extensive training datasets.
Projections
Projecting 3D data into another 2D space is another representation of raw 3D data where the projected data encapsulates some of the key properties of the original 3D shape. Multiple projections exist where each converts the 3D object into a 2D grid with specific information. Projecting 3D data into the spherical and cylindrical domains has been typical for representing the 3D data in such a format. Such projections help the projected data be invariant to rotations around the principal axis of the projection and ease the processing of 3D data due to the Euclidean grid structure of the resulting projections. However, such representations are not optimal for complicated 3D computer vision tasks such as dense correspondence due to the information lost in projection.
Implicit representation
Implicit representation is the lesser visual component of point clouds. It is a way to represent point clouds by a set of shape descriptors that can be seen as a signature of the 3D shape to provide a compact representation of 3D objects by capturing some fundamental properties to ease processing and computations (e.g. expressed as a .CSV file). For example, global descriptors provide a concise yet informative description for the whole 3D shape, while local descriptors provide a more localized representation for smaller patches in the shape. Implicit representation is convenient as part of a processing pipeline and eases data transfer among different infrastructures. It is also beneficial for advanced processes that benefit from informative features that are difficult to represent visually.
Figure 5: Depth map of a point cloud based on a top-bottom view.
Multi-view
A multi-view image is a 3D representation in which information is accessed by matching several 2D images of the same object from different points of view. Representing 3D data in this manner can lead to learning multiple feature sets to reduce noise, incompleteness, occlusion and illumination problems on the captured data. However, there is no definitive rule for how many views are enough to model the 3D shape. It is important to avoid incomplete capture of the shape properties while preventing overfitting. Both volumetric and multi-view data are more suitable for analysing rigid data with minimal deformities.
Conclusion
To summarize, when choosing the ideal 3D data representation method for your application, it helps to bear the following in mind:
3D point clouds are simple and efficient but lack connectivity
3D models such as 3D meshes, parametric models and voxel assemblies provide dedicated levels of additional information but approximate the base data
Depth maps are well known and compact but essentially deal with 2.5D data
Implicit representation encompasses all of the above and is beneficial for advanced processes that benefit from informative features that are difficult to represent visually
Multi-view is complementary and leverages raster imagery but is prone to failure due to suboptimal viewpoint selection.
Further reading
Poux and R. Billen, Voxel-based 3D point cloud semantic segmentation: unsupervised geometric and relationship featuring vs deep learning methods, ISPRS International Journal of Geo-Information, vol. 8, no. 5, p. 213, May 2019.
Poux, The Smart Point Cloud: Structuring 3D intelligent point data, Liège, 2019.
Karara, R. Hajji, and F. Poux, 3D point cloud semantic augmentation: Instance segmentation of 360◦ panoramas by deep learning techniques, Remote Sensing, vol. 13, no. 18, p. 3647, Sep. 2021.
Value staying current with geomatics?
Stay on the map with our expertly curated newsletters.
We provide educational insights, industry updates, and inspiring stories to help you learn, grow, and reach your full potential in your field. Don't miss out - subscribe today and ensure you're always informed, educated, and inspired.
Download this article as a print friendly PDF and receive our weekly overview of the most important geomatics news and insightful articles and case studies.
Sharing this article
Ofcourse we encourage you to share this article with your peers if you enjoyed reading it. Copy the URL below or share it on your social media of choice.
This site uses cookies. By continuing to use this website, you agree to our Cookies Policy. Agree