Road Safety Analysis
Terrestrial Laser Scanning to Improve Road Safety
With the growing interest in (inter)national road safety programmes comes a need for documentation of road systems for safety analysis and traffic-accident reconstruction studies. This requires reliable, accurate and timely data, which, as the authors demonstrate, Terrestrial Laser Scanning (TLS) can provide.
While driver and vehicle factors contribute to crashes, road-risk maps can help identify areas of roads where safety might be improved. Road inventory databases enable the move from 'black-spot treatment', that is improvement of sites associated with a high incidence of crashes, to route management and eventually to network safety management (www.reference.com/browse/wiki/road_safety). Terrestrial laser scanning (TLS) can serve these purposes, providing flexible and fast 3D documentation. Point-clouds can be used as input to any CAD system.
Road Safety Analysis
Road safety analysis requires data on sight (distance), drainage and geometric design features. The driver should have an unobstructed view of an intersection he approaches or leaves it. The view should include traffic-control devices and an area of the intersection adequate to enable him to anticipate and avoid collision. Main and secondary-grade roads should be designed such that drainage from the secondary road does not run onto or cross the main traffic lane. From 3D-models surface contours can be created using typical survey software that allows basic drainage principles to be checked. Geometric features are the final category of data needed for road-safety analysis and include break gradation between main and secondary roads, horizontal and vertical alignment of major and minor roads, and accommodation (for turning manoeuvres). Other such features are traffic lane and shoulder width, super elevation, skew angle (angle of intersection between major and minor roads), auxiliary lanes (left and right turn lanes, acceleration and deceleration lanes), island geometry, and turning radii.
Field Test
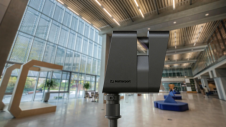
A T-junction, part of a two-lane national rural road in Greece, was scanned to test the suitability of TLS using a Leica HDS2500 (range: up to 150m, field scanning window: 40°x 40°, quoted single-point accuracy: 6mm at 50m). Data capturing required about eight hours for scanning at 25 positions. To ensure high precision the scanner-object distance, as recommended, never exceeded 50-60m for each position, and special spherical targets were placed in the scene as tie points and measured using a total station with a precision better than 8mm for each of the three coordinates. The tie points made it possible to transform all scans into a common reference system; the residuals varied from 1mm to 6mm (mean error: 4mm). Registration was performed in Cyclone, Leica proprietary software. From the point-clouds a simple 3D-model and a 2D-map of the scene were created. Such models enable definition of safety improvements; for example the widening of cut slopes, removal of roadside vegetation and reshaping the main road profile to provide required sight distance. The precision of the 2D-map was checked using total station measurements, resulting in distance differences in the order of 1-2cm, acceptable for these applications.
Qualitative Assessment
We also assessed the detail of information visible in the point-clouds under different light conditions (light/dark), road-surface conditions (dry/wet), and varying sampling intervals (5-10mm/10-25mm/50-70mm). For this we grouped the data into four categories, as defined in the ANSI D (1983) regulations:
- road configuration indicating road straightness and presence of curves and grades
- roadway surface materials, describing in detail if estimates of speed can be made from skid- or yaw-marks
- traffic-control devices, including data for road signals, signs, pavement markings, speed limit signs, prohibited turn and one-way streets; sometimes information is required about route markings, bridge clearances, and even roadside establishment signs
- road accessories such as curbs, guard-rails, bridges, culverts, median dividers, islands, tunnels and toll-gates, which may appear in accident reports when involved.
Concluding Remarks
Sight distance analysis can be easily performed using 3D-models created from TLS point-cloud data. The accuracy of TLS models makes easy checking drainage conditions in “difficult” positions such as curbs and islands. Geometric features required in road-safety analysis can also be extracted from TLS models.
Further Reading
- ANSI D 16.1, 1983, Manual on Classification of Motor Vehicle Traffic Accidents. National Safety Council, Chicago IL 60611, p 43.
- Road-traffic Safety, Reference.com, 2007, Wikipedia, the free encyclopedia. www.reference.com/browse/wiki/Road-trafficsafety (accessed: April 2007).

Value staying current with geomatics?
Stay on the map with our expertly curated newsletters.
We provide educational insights, industry updates, and inspiring stories to help you learn, grow, and reach your full potential in your field. Don't miss out - subscribe today and ensure you're always informed, educated, and inspired.
Choose your newsletter(s)


