Mapping the seafloor with remote sensing and satellite imagery
An analysis of the techniques and benefits of these methods
While 70% of the Earth is covered by water, very little of it has been surveyed so far (Mars, Venus and the Moon are better surveyed). The techniques for doing so have changed dramatically since the first measurements were made by Alexander Dalrymple and James Cook using lead lines and sextants. Single-beam echosounders were invented in the 1920s – a technology still used today for mapping the seafloor. This method can produce very high-resolution bathymetric data but the high operational costs and slow working process make it economically unsuitable for large areas. Scientists and engineers have therefore developed better and more effective technologies to map the seafloor, namely airborne technologies. Furthermore, with the increasing number of satellites observing the Earth, remote sensing data of the oceans has become widely available. Over the past decades, there has been increasing interest in airborne and satellite-derived bathymetry data. This article explains the methods of remotely mapping the seafloor in detail and their advantages and disadvantages.
Optical satellites
Optical satellite images obtain information on the water depth by analysing the spectral changes of the seafloor. This method is very effective for nearshore shallow waters. The idea behind this method is the usage of the reflectance intensity of different wavelengths of sunlight that are captured by the satellite sensors. This method has been further advanced by two major developments in the technology; the first being increased resolution of satellite data which allows for sufficient level of detail of the seafloor mapping, and secondly the design of robust and standardized algorithms and workflows. The classification of the datasets depends on two parameters: spatial resolution and pixel size. Of course, the most important factor is the spatial resolution: “The ability to map the seafloor in highest detail, the amount of spectral information and the bit depths in which they are recorded, signal-to-noise-ratio and the geolocation accuracies” [Hartmann, 2017]. There are four types of classification: very high-resolution datasets with better than 2m spatial resolution, high (<10m), moderate (<100m) and coarse (several hundred metres).
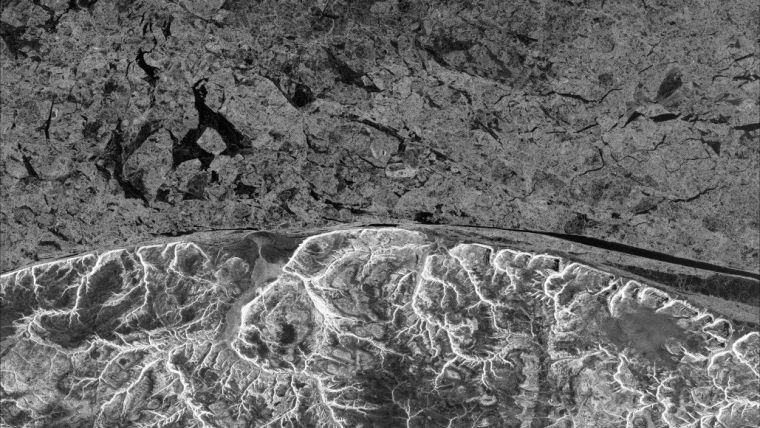
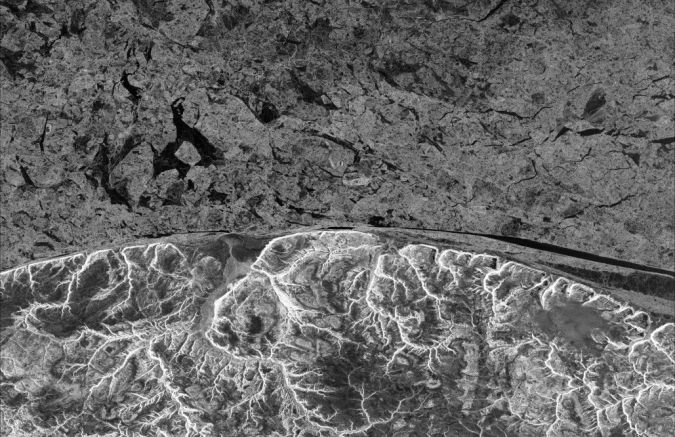
Synthetic aperture radar (SAR)
SAR is a method that is used for capturing the seafloor further from the coast. SAR works by detecting the changes in the wavelengths in the deep waters. The radar works by transmitting electromagnetic waves and then collecting, digitizing and storing their echoes for later processing. The backscatter data detected by SAR depends on the roughness of the sea surface and the length scale of the roughness.
Satellite altimetry
The basis of satellite altimetry is the known process of emitting a radar pulse and measuring the time it takes for the reflection to be detected. The biggest errors that mostly affect the altimetry-derived sea level are the orbit errors and errors in the environmental and geophysical corrections applied. It can be said that the satellite altimetry is unique among ocean remote sensing techniques because it provides us with much more information on the Earth`s gravitational field: the shape and the structure of the ocean floor, the integrated heat and the salt content of the ocean and the geostrophic ocean currents, than any other remote sensing technique. The global coverage measurements and the revisit time of several days makes this method one of the most frequently used. The accuracy of satellite altimetry varies between the satellites. The average claimed accuracy for global mean sea level averaged over a 10 day orbital cycle is 2-4mm. The biggest disadvantage of satellite altimetry is “the contamination of the radar signal near the coast when the reflection of the radar pulse is partly due to the ocean surface and partly to land” (Gomis, Monserat et al., 2012). As a consequence, the standard altimetry data is unreliable at distances shorter than 40 km from the coast.
Whereas most debates were previously related to the resolution and the accuracy, the cost of purchasing satellite images has dropped significantly over the past years. However, there is one large disadvantage of satellite imagery: the inability to wait for improved weather conditions (i.e. cloud coverage). We are probably approaching the day when we will have both aerial cameras and Lidar systems combined in one device to provide both data at the same time.
Another advantage of satellite imagery is the fact that we can use them as a time lapse. This information is vital to humanity to realize how large our impact on the planet is as well as to understand the range of natural disasters such as hurricanes, tsunamis and fires in recent years.
Airborne remote sensing
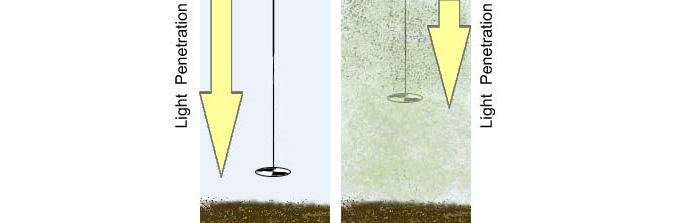
When discussing airborne remote data gathering one must not forget ‘Secchi Depth’, the methodology used to measure water turbidity or transparency. This measure is crucial for the accuracy of all airborne surveying techniques because it is the ability of the light to penetrate into the water. The turbidity or the transparency depends on the amount of particles within the water column. To measure the water clarity we need a ‘Secchi Disk’ (Fig. 2). The most effective seasons for measuring ‘Secchi Depths’ are spring and autumn (spring has slightly better Secchi depths, but autumn has a longer time window and the weather is easier to predict).
Aerial photogrammetry
Essentially photogrammetry is a combination of various aerial photography shots to create 2D or 3D models and derive measurements from them. Aerial photogrammetry is the process of taking pictures of large areas of land by mounting advanced digital cameras from the underside of an airplane.
If we compare the resolutions of aerial photography and satellite images, then the aerial photography has significantly better values. Comparing results from providers shows that Vexcel, for example, can provide aerial photography with a resolution of around 6.5cm. Satellite imagery is also quite accurate: GeoEye-1 can supply the user with panchromatic imagery down to 4.1cm resolution.
However, nowadays the resolution is just a small part of the specifications. The development of 3D models, GIS and CAD connections and the advances in automated image extraction are shifting the aerial photogrammetry to advanced work flows.
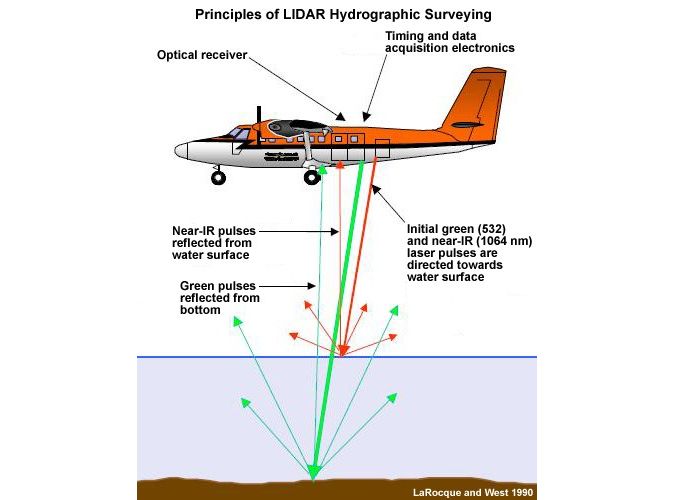
Light detection and ranging (Lidar)
Lidar is a method that uses both green and red light to survey a coastal region above and below sea level. The green light penetrates into the water body and captures the seafloor, whereas the red light is not able to penetrate the water body and therefore bounces back from the water surface. By using both colours it is easy to distinguish the water surface from the water column and water body floor.
As mentioned above, the most crucial thing to take into account is the Secchi Depth. Another important consideration is the power of the system. The more powerful the Lidar system is, the more it will penetrate into the water. Therefore, the Lidar systems on the market are split into one of two types depending on their penetration into the water column. One system type is able to reach 1 to 1.5 times Secchi depth and the other 2.5 to 3 times Secchi depth. At ideal viewing conditions the sea/river bed can be detected down to around 10m depth.
Other issues for the airborne cameras and lasers are the weather condition (fog, high surface waves, rain, and sun glint), bad detection and recognition of underwater features, and the data gaps due to vegetation or suspended sediment issues with bad backscattering. These gaps need to be filled by hydrographic surveys.
The Lidar data has a more area-wide homogeneous spread and a substantially bigger density of points per square metre when compared to the data derived from an echo sounder, SBES or MBES, which makes the morphological model produced from the Lidar data more plausible. The measurements both have: a very high-accuracy (± centimetres, depends on the depth) and a very high-resolution (between 20 to 30 points per m2). There are different types of measures describing the quality of the Lidar systems: vertical and horizontal accuracy, depth of the water measurement, distribution of the points and footprint size.
Affordable data map
It is evident that bathymetric airborne laser scanning, photogrammetry and satellite imagery will not replace traditional hydrographic surveys, however, these techniques are complementary to shallow-water mapping. The combined method of airborne satellite imagery, Lidar systems or aerial photogrammetry together with acoustic surveys, leads to a powerful and very effective manner to create maps of the seafloor. This is due to the fact that the acoustic surveys in areas with shallow waters (5-10m) require significant efforts and costs and are quite often very difficult to access. Contrary to that is the depth range in which airborne methods work optimally. Therefore, the combination of both methods form an affordable data map from the very shallow to the very deep. Furthermore, the overlapping between both methods can serve as a calibration and validation of the methods and as a proof of the quality of the data.
Nowadays, the comparison between satellite imagery, aerial photogrammetry and Lidar is not as simple as it used to be. There has been great progress on many fronts including computation, knowledge, services and last but not least, in software and hardware. So the best technique to choose depends greatly on its usefulness and whether it matches the goals we determine.
References:
Dr. Stefan Wiehle, The BASE-platform project, Hydrographische Nachrichten, 2017
Dr. Knut Hartmann, Dr. Thomas Heege, Dr. Magnus Wettle, Markus Bindel. Satellite-derived Bathymetry: Effective Surveying Tool for Shallow-water Zones, Hydro International, 2017
Damià Gomis, Sebastià Monserrat, et al – The Climate of the Mediterranean Region, 2012
R.E. Cheney, Satellite Altimetry, Encyclopedia of Ocean Sciences, 2001.
Andre Pleskavchesky, Stefan Wiehle, Sven Jacobsen et al., Sea State from high-resolution satellite-borne SAR imagery, Hydrographische Nachrichten, 2017.
Frank Steinbacher et al., High-resolution Topobathymetric LiDAR coastal zone characterization, 2016

Value staying current with geomatics?
Stay on the map with our expertly curated newsletters.
We provide educational insights, industry updates, and inspiring stories to help you learn, grow, and reach your full potential in your field. Don't miss out - subscribe today and ensure you're always informed, educated, and inspired.
Choose your newsletter(s)


