SfM photogrammetry for 3D terrain mapping
Accuracy assessment using RTK-based point-to-point validation method
The technique known as structure from motion (SfM) has been suggested as a valid alternative to traditional photogrammetric methods. In a project in Glasgow, UK, an RTK-based point-to-point validation technique based on two sets of randomly selected ground control points was used to assess the geometric accuracy of SfM technology for 3D terrain mapping over a small area.
SfM photogrammetry is an image processing technique that allows the reconstruction of accurate 3D models from overlapping successive photographs taken from cameras at various angles with or without ground control points (GCPs). These models are not only appealing but also contain spatial information, the quality and accuracy of which depend on both the acquisition method and the processing procedures.
The accuracy of an SfM-derived model can be assessed either by comparing it with a reference model or by measuring the deviation of the control points identified on the model. The measurements are taken using classic topographic survey methods and survey instruments of higher accuracy. To contribute to the knowledge of applicability, a real-time kinematic (RTK)-based point-to-point validation technique based on two sets of randomly selected GCPs has been used to assess the geometric accuracy of SfM technology for 3D terrain mapping over a small area.
RTK GNSS survey
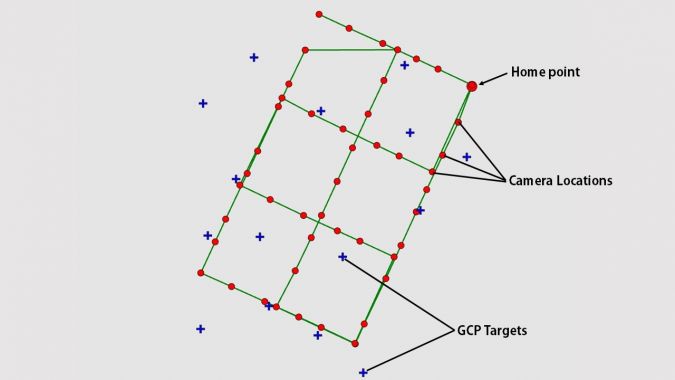
A total of 15 targets (GCPs) were evenly distributed and coordinated in the study area in Glasgow, UK (Figure 1) using Leica network RTK global navigation satellite system (GNSS). The coordination of the targets was linked to the GLAS continuously operating reference station (CORS) via Smartnet. Typically, network RTK solutions within the United Kingdom provide instantaneous results (that is, single epoch coordinate solutions) that achieve root mean square accuracies of around 10-20mm in horizontal position (XY) and 20-40mm in elevation (Z), with relatively small biases. The horizontal positional accuracy obtained from the GNSS RTK survey of the targets ranges from 5.1mm to 11.3mm while the elevation accuracy ranges from 9.2mm to 18.4mm. This result clearly shows a high level of accuracy and good data quality. Therefore, it was considered to be fit for purpose as reference data.
Drone survey for SfM
For data collection using an unmanned aerial vehicle (UAV or ‘drone’), a DJI Phantom 3 Professional equipped with a focal length of 20mm (35mm equivalent) and a sensor of 12.76 megapixels was used. The flight path was predefined on the drone mapping software. The home point of the drone was set from a zero base at one point and the images were captured in sequence according to the grid pattern shown in Figure 1 in order to ensure good coverage and visibility. At a flying altitude of 60m above ground level and an optimum overlap (75% front and 65% side overlap), the system captured 49 images in a single flight over an area measuring 153m in length and 129m in width. The flying height of 60m was chosen to ensure that a high-resolution dataset was captured whilst avoiding any interference of the drone with the surrounding trees. This also enabled the optimum acquisition of photos and minimized the processing time. All the images captured were geolocated and a ground sampling distance of 2.63cm was achieved.
Data processing (SfM workflow)
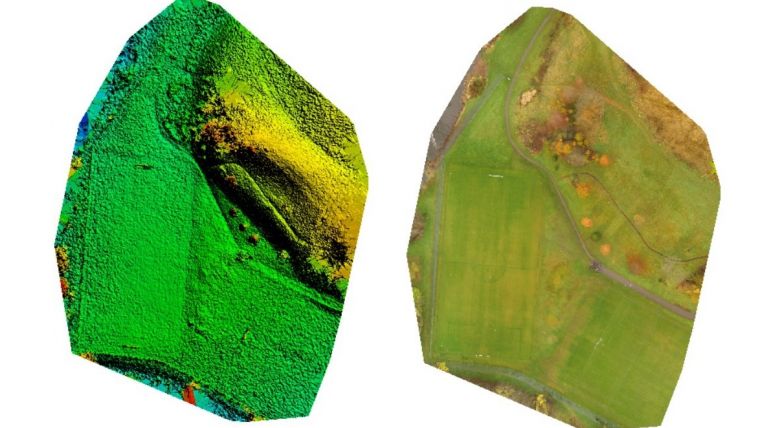
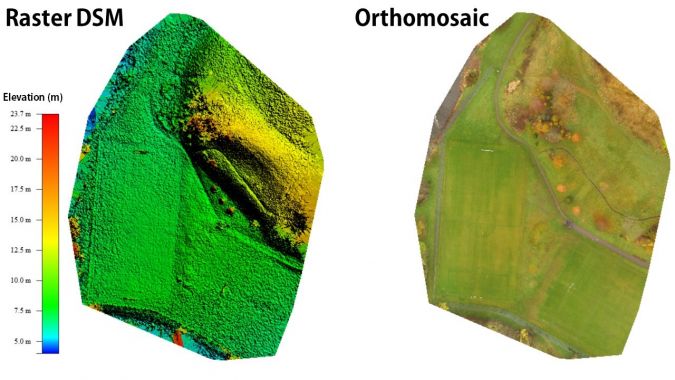
The data processing was done using Pix4Dmapper software. The processing workflow started with the initial processing that handles the image alignment and produces sparse point clouds. For this project, half image size was selected for two reasons: (i) to reduce the processing time, and (ii) to address the low texture in the captured images to improve the outputs. The 15 GCPs were imported and matched (georeferenced) using the rayCloud Editor menu available within Pix4D. The processing report revealed that the georeferencing accuracy was within acceptable limits (with mean RMSE of 27mm). The next stage was the point cloud densification. Here, a resampling to a quarter of the original resolution was used based on the recommendation for projects with vegetation. For each input image, a final point cloud was automatically saved to Lidar file format (.las) as selected during the initial processing stage, which is one of the most common formats for exchanging point clouds. Finally, both the raster DSM and orthomosaic were generated and the tiles were merged and saved in a lossless compression format of GeoTiff (.tif) to help preserve the image quality (Figure 2).
Validation test
There are three known validation methods for SfM data points: i) point to point (data points that compare two point clouds directly), ii) point to raster (data points that compare SfM-derived rasters such as DSMs with points from topographic data, e.g. GNSS and total stations, and iii) raster to raster (data points that compare SfM-derived DSMs with equivalent raster-based data products derived from another survey technique such as terrestrial laser scanning). However, the choice of validation method is dependent on the available reference data. Since the reference dataset was based on the RTK GNSS-derived coordinates of the target cross-hair, a point-to-point validation method was adopted. The point-to-point validation was done in two ways; firstly by using five of the GCPs as checkpoints, and secondly by using the remaining ten. This was done to evaluate the influence of the number of checkpoints on the root mean square errors (RMSEs) obtained. At this project’s flying altitude of 60m, the expected RMSE for a point-to-point validation is 80mm. The results obtained when ten checkpoints were used fell within the expected range (20.93mm, 18.48mm and 46.05mm in the X, Y and Z coordinates respectively). However, when five checkpoints were used, slightly higher RMSEs were obtained (45.90mm, 22.27mm and 75.26mm in the X, Y and Z coordinates respectively).
3D point cloud reconstruction
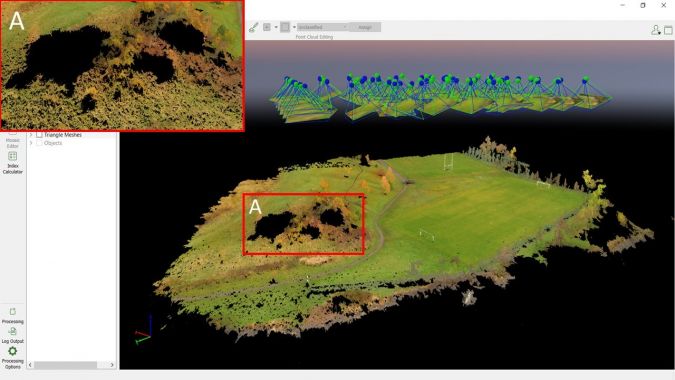
The point cloud densification operation achieved 3,386,259 points with an average density of 140.46 points per m2. The 3D point cloud produced is shown in Figure 3. This result is very interesting given the level of detail shown. However, as seen in the inset (A), there were some black areas (gaps) caused by shadows from some trees. The gaps occurred in those areas due to insufficient camera viewpoints. This implies that better results can be achieved if some of the initial parameters such as the overlap (front and side) and the flying height (60m) are varied. However, these variations may also be at the expense of the storage capability and the processing speed due to the large volume of data that will be involved. Nonetheless, the principle of economy of accuracy – that is, establishing a balance between cost and accuracy – is expected in every project. Thus, it was also considered in this study.
Conclusion - application of SfM photogrammetry for 3D terrain mapping
This article has examined the application of SfM photogrammetry for 3D terrain mapping. Essentially, the point-to-point method of validation using the RTK GNSS derived coordinates was employed to understand the achievable accuracy of SfM technology. Relevant factors such as overlap, the flying height and ground control points were considered in the assessment. The validation tests suggest that higher numbers of checkpoints, evenly distributed within the study area, could increase the accuracy of the model. However, further analysis would be required to test not only the influence of the number of ground control points on the accuracy, but also their configuration. To avoid black areas (gaps) in the model, it is imperative to have many camera viewpoints and an adequate number of GCPs distributed evenly within the area of interest. Generally, it is to be noted in line with literature that the quality of the data captured is dependent on the methodology adopted and should be taken into consideration.
Acknowledgements
The authors are grateful to the School of Geographical and Earth Sciences, University of Glasgow, where the fieldwork for this article was conducted as part of coursework in the Geospatial and Mapping Sciences programme. A special thanks and appreciation go to Pix4D Support who made their help files freely available and accessible.
Further reading
Iheaturu, C. J., Ayodele, E. G., & Okolie, C. J. (2020). An assessment of the accuracy of structure from motion (SfM) photogrammetry for 3D terrain mapping. Geomatics, Land Management and Landscape, 2, 65–82. https://doi.org/10.15576/gll/2020.2.65


Value staying current with geomatics?
Stay on the map with our expertly curated newsletters.
We provide educational insights, industry updates, and inspiring stories to help you learn, grow, and reach your full potential in your field. Don't miss out - subscribe today and ensure you're always informed, educated, and inspired.
Choose your newsletter(s)


