Scientists Calculate Icefield Melting with 2D and 3D Glacier Model
The Juneau Icefield Research Program (JIRP) has calculated that thinning of Alaska’s Taku Glacier has increased from an average rate of half a metre to two metres per year over the past two decades. Annual mapping by JIRP reveals the glacier’s thickness has increased and decreased from one year to the next, likely due to snow accumulation variability, but the overall current trend shows an annual net loss of ice.
“Taku is losing enough meltwater every day to fill an NFL stadium,” said Seth Campbell, JIRP director of Academics & Research.
Yearly GPS field points
JIRP monitors the complex kinematics and mass balance of the Juneau Icefield – that is, they study annual changes to ice velocity, snow accumulation, and surface melting – to estimate if the glacier is advancing or retreating over time. One way they accomplish this task is by mapping yearly GPS field points in the Grapher and Surfer modeling packages from Golden Software, a developer of 2D and 3D scientific software based in Colorado.
“JIRP’s study of the many processes impacting the Juneau Icefield demonstrates the value of applying advanced visualization to gain insights from complex data sets,” said Golden Software CEO Blakelee Mills.
Accurate assessment of the Taku melt rate is vital to the study of climate change because, at more than 800 square kilometers, the glacier is the largest in the massive Juneau Icefield. Straddling the Alaska-Canada border, the receding icefield plays multiple important roles in local ecosystems. For the residents of British Columbia, it is a reliable supply of freshwater, but for the Gulf of Alaska, increasing glacier meltwater can have potentially negative impacts the marine ecosystem and valuable fisheries.
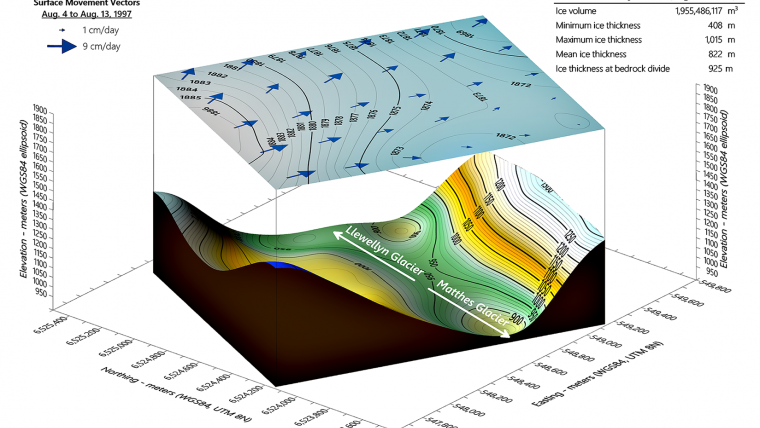
Overall glacier volume change
JIRP research dates to 1946, but the introduction of GPS contributed significantly to annual summer fieldwork beginning in 1993. Volunteers capture more than 1,000 GPS measurements at designated transect locations on the icefield each year to record glacial velocity and surface elevation changes. These values reveal whether the glacier is growing or shrinking due to changes in precipitation or melt rates or from changing rate of movement.
“We have seen increases in thickness after particularly snowy winters,” said Scott McGee, JIRP Geomatics Program Lead. “But less snow accumulation and more surface melt seem to be the primary drivers of change now.”
JIRP researchers rely on Golden Software’s Grapher scientific graphing package to plot GPS “Z” elevation values across transects in 2D to generate thickness profiles. They often overlay multiple years’ worth of field data to illustrate change over time. The scientists also input GPS field points for multiple transects from multiple years into the Surfer 3D surface mapping package to gain a sense of overall glacier volume change.
Together, these ice elevations, velocities, and volume change calculations give researchers a better understanding of external forces acting upon the Juneau Icefield and what to expect in the future. Read the full case study here.


Value staying current with geomatics?
Stay on the map with our expertly curated newsletters.
We provide educational insights, industry updates, and inspiring stories to help you learn, grow, and reach your full potential in your field. Don't miss out - subscribe today and ensure you're always informed, educated, and inspired.
Choose your newsletter(s)


