3D-Model of Siberian Fortress
Exploration and preservation of Por-Bajin fortress, testimony to the former presence of ancient civilisation in the wildness of Siberia, is one of the largest-scale projects in modern archaeology. Combining terrestrial laser-scanning, magnetic field and electrical resistance data revealed anomalies that had remained concealed during fieldwork and in aerial photos.<P>
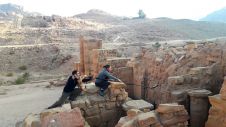
In 750AC the chief of Uigurian chagan Eletmish Bilige-chagan conquered the territory of today’s Tuva, Republic of Russia. To consolidate power he built Por-Bajin fortress (“the clay house”) on the island of Tere-Khol, with walls as high as ten metres that required the shipping of thousands of tons of clay and brick stones. Within its walls, the labyrinth of buildings resembled the Buddhist or Hindu mandola. The central palace, built on a high platform, belonged to Eletmish Bilige-chagan himself. Archaeologists and geographers have been studying the remains on the island, which can be approached via a 2km-long wooden bridge, since the nineteenth century. But in-depth investigations had to wait for today’s advanced technology.
Workflow
It takes two hours to get from Kyzyl, the capital of Tuva, to the archaeological camp on the lakeshore by helicopter, the only way to deliver food, medicaments and fuel. They fly several times a day during summertime, the excavation period. Archaeological research of a big area is expensive. The main goals of Por-Bajin Fund, which is organising the project, are complex investigation of the fortress, and probably its reconstruction. Participating are not only archaeologists and architects, but also specialists in hydrology, geology and geophysics, as well as students from several Russian and foreign universities. Figure 2 shows the outline of an archaeological workflow. The localisation problem, that is precise identification of areas to be excavated, is solved at the end of the archaeological-survey stage. The more data is collected then, the better archaeological features can be localised, and precise localisation helps to save time and money in the expensive and time-consuming excavation stage.
Integrated Analysis
Archaeological survey data can be obtained by surface, aerial or geophysical methods. The latter are non-destructive, cheap and fast, and they avoid ethical issues. Geophysical methods are many and widespread, electrical-resistance and magnetic-anomaly surveys being the most popular. Combining geophysical with elevation data allows marking of anomalies, which indicate underground archaeological objects. This method, called integrated analysis, is based on the work of Dr Mikhail Kats, “Geotekhnologia”, and Dr Igor Modin of Moscow State University, and was first applied in Memphis, Egypt, in 2001. In place of the not yet available laser-scanning technology, a Trimble GPS 4000SSE was used to acquire the elevation data. Around 5,000 points were collected in continuous kinematic mode, over 0.8 hectares with on average 0.6 points/m2. The combination of elevation map with magnetic-anomaly map showed evident correlation. Laser-scanning was first used for elevation surveys at the famous Kulikovo Polye battlefield, where Russian principalities combated the Golden Horde in 1380. One workday of laser scanning with a Trimble GS200 gave 254,000 points over 5.6 hectare, resulting in about 4.5 points/m2.Here too the combination of elevation with magnetic-anomaly data proved very useful. In the Por-Bajin project laser-scanning data has been combined with magnetic field and electrical resistance data.
Fieldwork
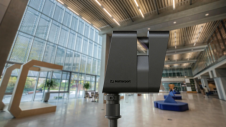
Each day a Trimble GS200 kit, Total Station Nikon NPL362 kit, a laptop and a petrol generator were transported to the island over the wooden bridge. In spite of changeable weather, which could vary in one day from heat to snow, with gusty winds, all devices worked properly. The relief appeared much more complex than indicated on aerial photos analysed beforehand in Moscow. Many remains of inner walls had a height of up to 1.5m, which produced numerous shadows on the scans. It takes about a day to scan eight hectares over flat ground, but the six hectares of Por-Bajin required no fewer than four days and fifteen stations; the absence of dual-axis compensation in the scanner contributed to this time. Every station thus required five to six reference points, measured by total-station. Overgrown depressions impossible to scan were also measured using the total-station.
Anomalies
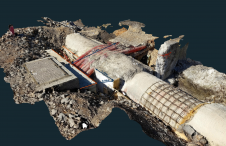
The measurements were transformed into a TIN-model (Triangular Irregular Network) anda 1:200 topographic map with 0.2 m isolines interval. The first and important stage was accurate separation of the 14 million laser points into surface and vegetation points. This was done by the Topography-Based Sampling function in Trimble’s point-cloud processing software: RealWorks Survey. The total-station points taken of overgrown depressions were added. TIN creation and processing was done using RapidForm-2006 from INUS Technology, which allows the size of triangles to depend on surface curvature. The resulting TIN-models were so impressive that they have been used by archaeologists in almost all their presentations on the Por-Bajin project. The topographic map served in planning excavations, which began a few days after scanning. The map showed two symmetrical anomalies in the middle of the fortress, marked yellow in figure 8, which remained concealed during fieldwork and on aerial photos. Excavation of the anomalies, which appeared also to be present in the geophysical data, disclosed a collapsed roof. Back in Moscow, two men created a precise 3D-model of the island and made a detailed elevation map and a topographic map on 32 sheets; thanks to laser-scanning technology, it took them just two weeks. All data has not yet been interpreted.
Concluding Remarks
Had the new Trimble GX scanner been available, its dual-axis compensator would have allowed faster registering of every station. Trimble SureScan Technology would have enabled the keeping of constant, user-defined resolution, regardless of distance (see www.trimble.com ). The wireless connection between scanner and laptop turned out to be very comfortable, because the crew could hide cosily from the gusty wind or, when it was hot, from swarms of midges, while the scanner stayed in operation. One of the main problems was rich vegetation; springtime would have been better for fieldwork. The right choice of good software contributed greatly to the success of the project.f
Acknowledgements
Thanks are due to Dr Mikhail Kats and Dr Sergey Sokolov, “Geotekhnologia”, Dr Igor Modin, Moscow State University, and Mr Oleg Pomogaev of the Por-Bajin Fund.
Further reading
Pomogaev O., Egypt’s Hidden Depths, GPS World, November 2002.
Mikhail Anikushkin, Laser Scanning Department, NAVGEOCOM, Pavla Korchagina Street 2, 129626, Moscow, Russia, email: 3d@navgeocom.ru

Value staying current with geomatics?
Stay on the map with our expertly curated newsletters.
We provide educational insights, industry updates, and inspiring stories to help you learn, grow, and reach your full potential in your field. Don't miss out - subscribe today and ensure you're always informed, educated, and inspired.
Choose your newsletter(s)


