How Real-time Monitoring Reduces Water Losses
Water Supply and Sewerage Network Management
Real-time monitoring can reduce long-term losses caused by holes across a network of water pipes. At 6 bar pressure, a pipe with a 6mm hole will leak 1.8 cubic metres per hour, which equates to 1,300 cubic metres per month – and this is enough to fill an Olympic-size pool after less than two months. There could be numerous small, barely visible and hence difficult-to-detect holes across a network, resulting in substantial long-term water losses. This article explains how real-time monitoring can reduce those losses.
Non-revenue water (NRW) is a key factor in the effectiveness of water supply and sewerage (WSS) companies all over the world. The World Bank estimates the annual volume of NRW in developing countries at 26.7 billion cubic metres and losses of US$5.9 billion for the WSS companies.
Bulgarian WSS company
The WSS company of Targovishte in Bulgaria is aiming to minimize water losses and improve the network management. The first water capture for the town of Targovishte dates back to 1898, and its water network was established in 1905. Today, the company provides services for about 111,000 consumers across 182 settlements in the Targovishte province. It employs 312 people, making it a mid-size WSS company in Bulgaria. Each year, about 13 million cubic metres of water are transported along its 2,000km network, including about 7 million cubic metres of NRW.
The specific WSS management challenges in Bulgaria are related to factors including the outdated infrastructure, lack of investment and changes in water consumption. Support teams are mostly engaged with repairs on existing – and usually visible – cracks, and activities are rarely subject to any more comprehensive planning. Registers are often stored only as Excel files and there is not usually a system for complete data management. Instead, information is stored randomly in different administrative units without procedures for exchange and quality control.

The lack of continuous logging devices is a nationwide problem. System input volumes (SIVs) of water are usually measured in-situ. The calculated water balances are based on unreliable and inaccurate data, and this makes network assessment and decision-making complex. Network mechanisms are also manually controlled, leading to additional damages.
Elements of sustainable management
Searching for, detecting and repairing leakages requires not only proper equipment for the field teams, but also accurate information. Such information is gained from data stored, processed and analysed in information systems. While some departments use specific tools and information systems like network registers, incident databases, customer information systems, etc., others compile annual water balance sheets or collect information on planned repairs. All of this information needs to be shared for a targeted use. It is however essential not only to use the data for the specific task, but also to keep it synchronized in order to keep maintain strong alignment between the different departments in a company. Such an approach supports early detection of leakages and optimal decision-making to deal with them. Therefore, the various information systems should not only to work together but also be integrated in a comprehensive GIS system.

Tobel GIS solution
Targovishte is now working with a solution based on the Tobel GIS software from the Bulgarian company Mapex. The software uses a client-server architecture and is specifically developed for Bulgaria. It is available as a desktop, mobile and web application. As an initial step for the GIS integration in the workflow of the Targovishte WSS company, only the desktop application – which works with a centralized database for information storage – has been used. The software has network topology and specific reports designed for a WSS.
The WSS database in Tobel is divided into three main categories: water supply network, sewerage network, and damages and repairs. The first two represent the variety of network assets (pipelines, pump stations, pressure controls, hydrants, etc.). For each of them, a relevant set of attributes is available consisting of common parameters such as year of construction and condition. Most attributes are asset-specific. For example, the attribute table for pipes also consists of inventory number, type, location, type of water, material, diameter, pressure, flow, depth, inspections, length, start and end points, and attached files.
An asset register is essential for a WSS in order to monitor its complex network. The best way to maintain an asset register for a water network is in a GIS environment where the network can be represented in a realistic spatial manner. The data from the asset register can be used to analyse the nightly water flow, calculate the water balance, perform hydraulic modelling, register damages in a database, register District Metered Areas (DMA) water consumption, and design the DMA and Pressure Management Areas (PMA) zones.
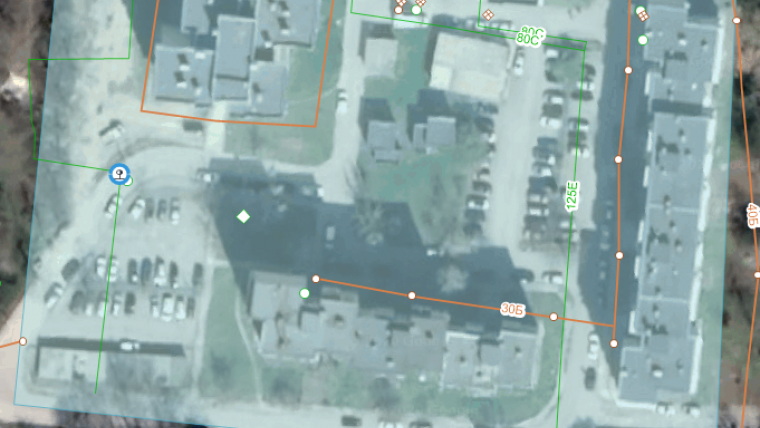
Although monitoring stations are an integral part of the WSS network, they are separated in an additional dataset in order to facilitate the integration of the variety of available sensors in general. This is appropriate as measurement stations differ from the regular asset information and have specific attributes. Their relation to the WSS network is set without changing the attributes of other features. As an example, a DMA zone turns to red if a value from a sensor within it passes any of the user-defined thresholds, and remains blue if it is within the norm.

Real-time monitoring and reduction of water losses
The availability of suitable, accurate and reliable metering devices in-situ is crucial for finding leakages and reducing water losses. There are three main methods for early warnings about new leakages and hence for effectively reducing the water losses. One method is based on continuous water flow monitoring in an open network or DMA zone, in which case increased levels of water flow indicate a possible leakage. Another method is pressure monitoring. High levels of water leakage increase the water flow and decrease the pressure. While small leakages do not have a significant impact, large ones can be detected in this way. Therefore, pressure data is used to prioritize detection activities; further analysis should start in zones with the lowest pressure levels.
LoRaWAN technology in metering devices
LoRaWAN is an open radio frequency protocol that allows devices to connect to the internet over a long range with low power consumption. With a long battery life of up to five years combined with reduced maintenance cost of the sensor network, LoRaWAN is an ideal technique for connecting metering devices to the internet. While power and internet connectivity are not usually an issue in big cities in Bulgaria, they can present a problem in smaller settlements and remote places where a WSS network is active. Currently there are seven LoRaWAN devices in use, all located in the town of Tragovishte. The devices have one or two analogue and one or two pulse inputs to collect resource consumption or event information from various types of analogue sensors and metering equipment. The sensors can record water pressure, water flow and water consumption and are currently set to record data every couple of minutes. This ensures continuous operation for approximately five years.

Each sensor is registered in Tobel with its location, sensor type, device type, ID and input, and coefficients. The collected raw data is stored and accessed via Tobel, using each sensor’s ID to read its particular values and when those values were acquired (time and date). Depending on the sensor type, there can be some additional calculations. For example, the water flow can be calculated as a function of water consumption over a period of time.
The future plans for monitoring the WSS network, which includes three municipalities, would take full advantage of the LoRaWAN features and would eventually enable the network to be monitored with a minimum of technical support over time.
Concluding remarks
The client-server geospatial solution presented here is a key instrument for keeping a comprehensive, accurate and up-to-date register, analysing past activities and planning for the future. But introducing the real-time monitoring takes WSS management to a whole new level. Having desktop access to current field data is crucial for timely response to leakages, and the visualization of indicators on a map will improve the search for and detection of leakages.
Acknowledgments
The authors express their gratitude to the whole team that worked on developing this solution.


Value staying current with geomatics?
Stay on the map with our expertly curated newsletters.
We provide educational insights, industry updates, and inspiring stories to help you learn, grow, and reach your full potential in your field. Don't miss out - subscribe today and ensure you're always informed, educated, and inspired.
Choose your newsletter(s)


