Soil mapping with drones
The use of gamma-ray spectrometers in airborne surveys
The Earth sciences sector is rapidly adopting UAVs. These two studies have explored combining a gamma-ray spectrometer with a drone to map soil properties.
In the Earth sciences sector, sensors for measuring properties of the Earth are rapidly becoming adapted for drone use now that new developments in technology have led to an increase in the size and payload of unmanned aerial vehicles (UAVs or ‘drones’). This article presents two studies that explore the opportunities for adding a gamma-ray spectrometer to a drone in order to map the texture or contamination of soil.
Gamma-ray spectrometers have a long tradition of use as a geophysical tool for mapping soil and sediment properties, but their large size and weight has so far prevented these sensors from being used in drone applications. However, recent developments in sensor hardware, combined with data processing algorithms that enable the extraction of every last piece of information from the acquired data, have resulted in gamma-ray spectrometers that weigh as little as 3kg. This substantial weight reduction means that it is now feasible to attach them to drones and opens up a new range of applications for the use of gamma-ray spectrometers in airborne surveys.
From sensor to soil map
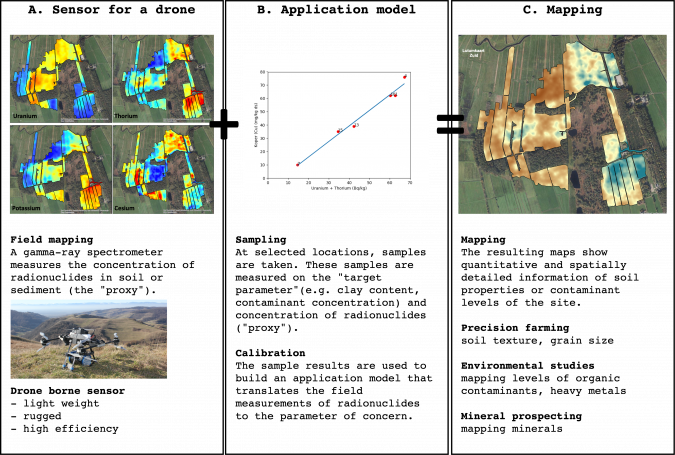
A gamma-ray spectrometer directly measures the concentrations of radionuclides present in the environment, whether naturally occurring radionuclides such as potassium, uranium and thorium or man-made radionuclides such as caesium (137Cs). These measurements provide the input for application models which correlate the concentrations of the radionuclides with the soil property or contaminant of interest. To do this, it is of great importance that the field measurements provide quantitative and accurate results. Therefore, proper sensor calibration and the proper selection of the sensor size in relation to its application are a must.
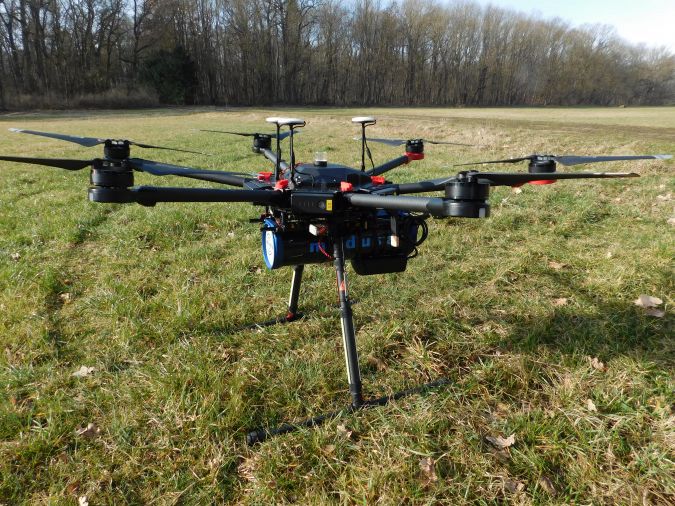
Gamma-ray sensors can be used for soil mapping, environmental studies and mining based on a three-step approach (Figure 1). This starts with attaching a sensor under a drone to measure the radionuclides. Next, an application model is developed that translates the measured data into soil parameters. The maps of the properties of interest can then be generated.
Soil mapping comparison study
For mapping soil composition, a gamma-ray spectrometer is often applied using a ground-borne vehicle such as a tractor, gator or quad. However, the use of a drone makes it possible to map the soil properties of terrain that is difficult to access, such as when the land is covered in vegetation or when access to the field is undesirable.
To evaluate the quality of the resulting maps measured by a gamma-ray spectrometer mounted under a drone, the authors designed a comparison study to predict the physical soil properties of 40ha of farmland in Flevoland, the Netherlands. In the project, measurements using a gamma-ray spectrometer (an MS-2000 sensor from Medusa Radiometrics) mounted on a tractor were compared against measurements from a drone-borne gamma-ray spectrometer (an MS-1000 sensor from Medusa Radiometrics) and against traditional soil samples. The MS-1000 is a low-power, lightweight and robust gamma-ray detector system specially designed for use with drones. The sensor, which weighs 7.7kg, was mounted under a standard, commercially available drone (DJI M600 PRO). The drone flew at an average elevation of 14m with survey lines 30m apart.
The application model in the study was based on 14 soil samples taken and analysed in the lab on radionuclide content and clay fraction. The model (Figure 2) was used to translate the field values of 232Th into a map showing the concentration of fines (<50µm).
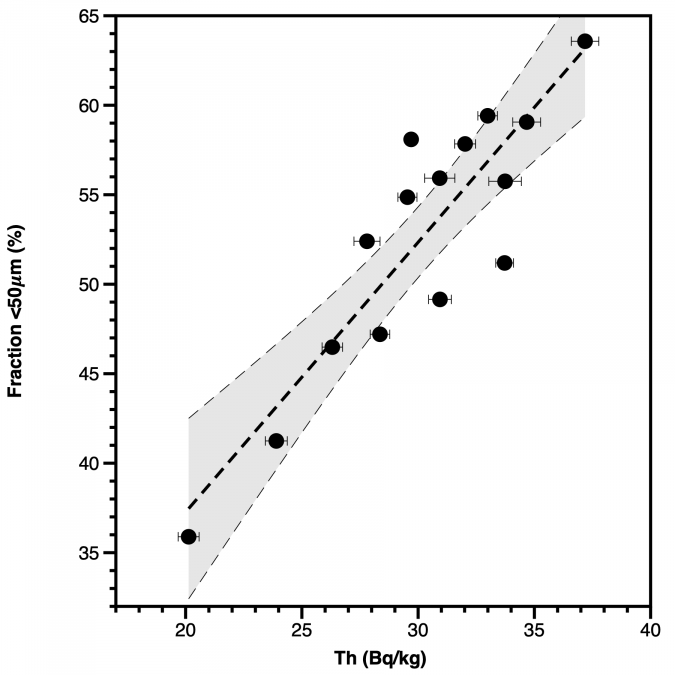
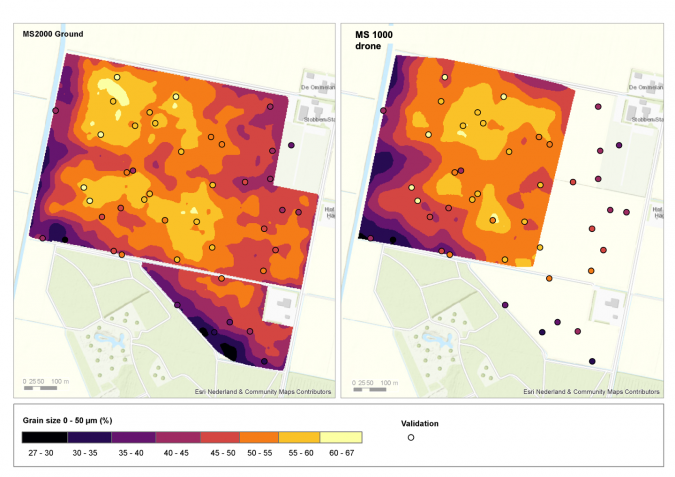
Figure 3 shows the resulting maps when this application model was used to translate the spatial 232Th concentration to spatial grain size variation. The ground measurements show the variation in clay content when it was measured with an MS-2000 detector on a tractor. The airborne map shows the clay content based on the measurements using the MS-1000 drone-borne detector. A separate set of 44 soil samples was taken and used for independent statistical validation.
The maps of the ground-borne measurements and the drone-borne measurements are a close match, but the results from the drone are ‘smoother’ and show a lower spatial resolution. This difference in the size of spatial structures is to be expected as the drone captures radiation from a larger area and thereby has a larger footprint. Closer analysis and validation of the maps revealed that the quality of the drone-borne map is on a par with the ground-borne survey, and that both approaches are as good as soil sampling.
Mapping soil contamination
Environmental contamination due to human activity is recognized as one of the modern dangers of society’s industrial advancements. This contamination involves organic contaminants and heavy metals due to historic releases by current and former industrial practices. Since the contaminants can enter the food chain by uptake in biota, the environmental restoration or closure of contaminated sites is a priority.
The current approach to managing and monitoring contaminated sites involves invasive and often labour-intensive methods, particularly in order to collect samples to quantify and map the distribution of contaminants. As a result, the contours of the contaminant distribution based on the samples are subject to a number of potential errors depending on sample size and inter-sample spacing, with the risk that ‘hotspots’ remain unmapped.
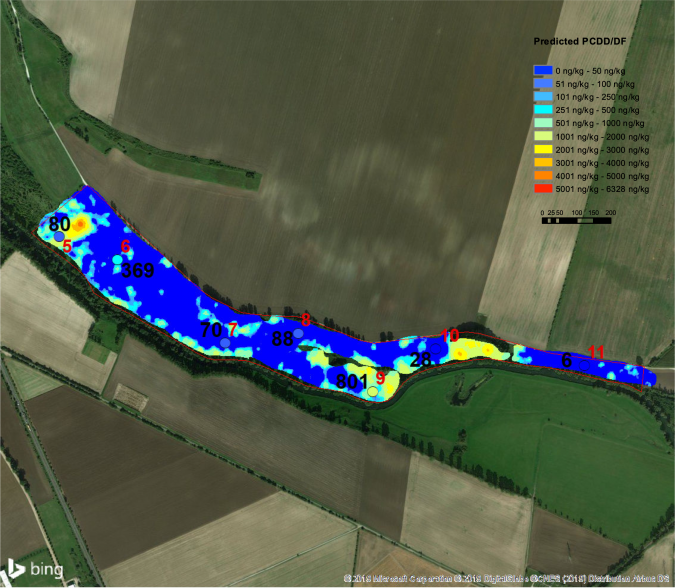
Many contaminants in aquatic sediments are adsorbed to clay particles. This means that contaminant levels are strongly correlated to the composition of these sediments when underwater, or of the soil when the sediments are deposited on floodplains. At Spittelwasser Creek, one of the tributaries of the River Elbe in Germany, the floodplains had been used as stacking basins for heavily contaminated wastewater during flood events, causing them to become contaminated with organic chemicals such as dioxins. The floodplains had already been the subject of numerous investigations dealing with the contamination of sediment and soil. The decision was taken to conduct a drone-borne mapping survey, partly because some of the areas were difficult to access physically and partly because the landowners were unknown for some areas, which meant that access permits could not be acquired. For the airborne survey, the MS-1000 was mounted under a DJI M600 drone. The drone flew at an average elevation of 7m with survey lines 10m apart, enabling the 50ha site to be mapped in just three days.
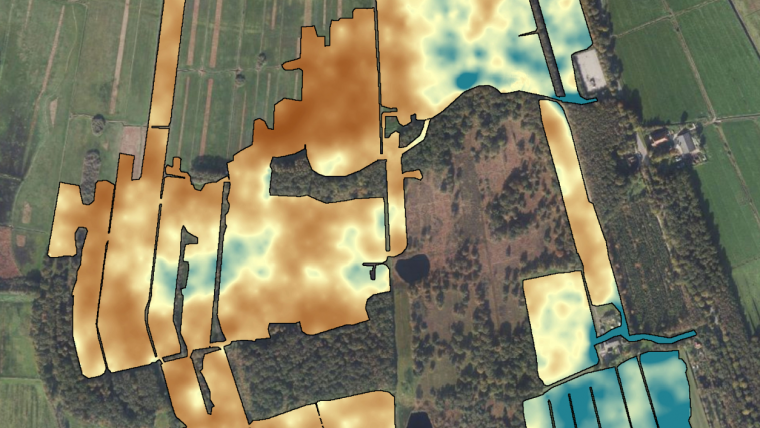
The survey resulted in integral maps of sediment contaminant levels (Figure 5) showing that the majority of the area has relatively low concentrations of contaminants, but that there are some hotspots. This data provides the government with detailed information on the contamination on a river-basin scale, which is crucial for defining proper remediation measures.
Conclusions
The geospatial mapping industry has changed considerably in recent years due to the use of drones for generating maps of the surface of the Earth. So far, the use of drones in the geophysical domain has been limited and most of this work is done with ground-borne surveys or surveys from larger aircraft. However, the geophysical industry continues to evolve and sensors have become smaller, lighter and more user friendly. These smaller sensors can now be used in combination with drones to map soil texture and soil contamination at high spatial resolution. Both of the drone-borne surveys presented in this article were executed using an off-the-shelf drone and a gamma-ray spectrometer. The first study demonstrated how soil texture can be mapped using such a setup. The second study showed that the same setup can be used to map contaminants with an unpreceded spatial resolution. These results demonstrate that gamma-ray sensors are ready to be routinely applied in drone-borne mapping projects. This opens up the possibility to perform high-resolution mapping surveys of soil texture and soil contamination in areas that would otherwise be inaccessible.
What is a gamma-ray spectrometer?
A gamma-ray spectrometer measures the concentration of radioactive elements in the Earth. All rocks, soil and sediments contain tiny but measurable traces of naturally occurring radionuclides such as potassium (40K), uranium (238U) and thorium (232Th). The radiation emitted by these nuclides carries information on the mineralogical composition of the rocks and soils. This phenomenon is used, for instance, in oil & gas and mineral prospecting to gain a qualitative image of the mineral composition of an area or rock matrix. It is important to note that, in contrast to many other geophysical technologies, gamma-ray spectrometers are passive sensors. Rather than emitting radiation, they capture it. The capture probability, and thereby the detection efficiency, is directly proportional to the volume of the detector. Therefore, a bigger detector means better efficiency. This size dependency is the reason that, in traditional airborne surveying, large, multi-crystal detector ‘packs’ of 80kg are used. However, recent developments have resulted in much lighter sensors, making it feasible to use gamma-ray spectrometers beneath drones.
Acknowledgements
The mapping projects described were conducted for Landesanstalt für Altlastenfreistellung (LAF) of Sachsen Anhalt, Germany, and for Wageningen Environmental Research, the Netherlands.
Further reading
Drone-borne gamma-ray - Medusa Wiki - The Medusa Institute
van der Veeke, S., Limburg, J., Koomans, R.L., Söderström, M., de Waal, S.N., van der Graaf, E.R., 2021. Footprint and height corrections for UAV-borne gamma-ray spectrometry studies. J. Environ. Radioact. 231. doi:10.1016/j.jenvrad.2021.106545
van der Veeke, S., Limburg, J., Koomans, R.L., Söderström, M., van der Graaf, E.R., 2021. Optimizing gamma-ray spectrometers for UAV-borne surveys with geophysical applications. J. Environ. Radioact. 237, 106717. doi:10.1016/j.jenvrad.2021.106717
van Egmond, F.M., van der Veeke, S., Knotters, M., Koomans, R.I., Walvoort, D.J.J., Limburg, J., 2018. Mapping soil texture with a gamma-ray spectrometer : comparison between UAV and proximal measurements and traditional sampling : validation study. Wageningen, the Netherlands. doi:10.18174/466037

Value staying current with geomatics?
Stay on the map with our expertly curated newsletters.
We provide educational insights, industry updates, and inspiring stories to help you learn, grow, and reach your full potential in your field. Don't miss out - subscribe today and ensure you're always informed, educated, and inspired.
Choose your newsletter(s)


