Producing High-quality 3D Point Clouds from Structure-from-Motion Photogrammetry
How to Produce High-quality 3D Point Clouds
Anyone involved with structure-from-motion (SfM) photogrammetry has probably questioned which type of processing software is necessary for them to produce quality 3D point cloud data. Many SfM software packages exist that allow for the generation of 3D point clouds from image sequences acquired via unmanned aerial systems (UASs). Each of these software packages provides different workflows and parameters for implementation of SfM processing and for point cloud densification using multi-view stereo (MVS) algorithms. To examine the influence of terrain on the results, this study compares differences in point clouds generated by three different types of SfM software.
It is well known that SfM/MVS point cloud fidelity is influenced by several factors, including terrain characteristics (e.g. surface texture). The influence of terrain on SfM software solutions is difficult to characterise and not well examined. As an attempt, this study compares differences in point clouds generated by three different types of SfM software: two well-known commercial packages, Pix4D and Agisoft PhotoScan, and an open-source set of tools called OpenDroneMap.
Terrain types
Five terrain types were imaged utilising a DJI Phantom 3 Professional UAS. These terrain types included a marsh environment, a gently sloped sandy beach and jetties, a forested peninsula, a house, and a flat car parking area. The house survey was the only survey that provided an oblique-perspective 3D point cloud comparison. Each set of imagery was processed with each software package and the point cloud results were directly compared to each other.
Each drone survey was automated so that human error could be minimised during the image collection process. The Pix4D Capture application was chosen for flight automation because it gives the user different options of flight paths (grid mission, double grid mission, circular mission) and offers a larger range of flying heights. Other options that can be controlled with this application are speed, image overlap and camera angle.
Data processing
The first step of the data processing was to verify that all three software packages utilise the same camera calibration model. The camera calibration model is responsible for triangulating the derived 3D points based on the internal camera parameters. The camera model used for this study was a typical five-parameter camera model (R1, R2, R3, T1, T2) where R1, R2 and R3 describe the radial distortion while T1 and T2 describe the tangential distortion. After the calibration model was confirmed, the software settings were analysed and chosen in a manner that allowed for the most similar settings to be set across the three software packages based on recommended or default settings for the version of software at the time of this study (autumn 2016). This was done in an attempt to minimise point cloud differences caused by dissimilar settings.
A total of 15 point clouds were generated: five terrain types each processed by three different software. The three point clouds of a common terrain type were compared against each other to better understand how each SfM software package handled different terrain types and to see how the quality of the point cloud data differed. The following characteristics and statistics were recorded for each point cloud: the density, the average spacing of the points, and the total number of points as well as the minimum, maximum, mean and standard deviation of the X, Y and Z coordinates. Tables 1 to 4 summarise the recorded statistics.
Point cloud density
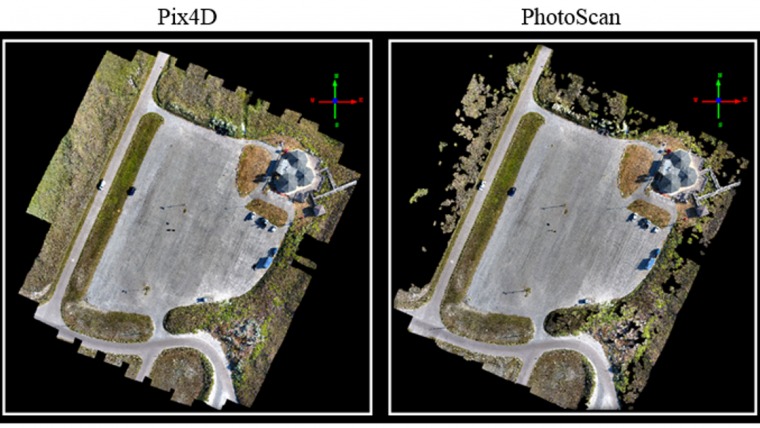
When looking at these tables it is easy to see that Pix4D and Agisoft PhotoScan stand out as being very close in the comparison between density, spacing and number of points. When considering the number of points, the following percentages were determined. For the marsh experiment, Pix4D produced 7.3% more points than Agisoft PhotoScan and 99.01% more than OpenDroneMap. The beach process resulted in 15.58% more points than Agisoft PhotoScan and 99.2% more than OpenDroneMap. For the peninsula survey, Pix4D created 53.4% more points than PhotoScan and 99.9% more than OpenDroneMap. This is due to false matching issues over water that Pix4D handled better based on the settings utilised. PhotoScan could likely be reprocessed to resolve this concern. Out of all the surveys, the car park survey resulted in the highest-density point clouds among all three software packages. Pix4D generated 15.03% more points in the car park than PhotoScan and 98.8% more than OpenDroneMap. The difference between Pix4D and PhotoScan was due to more densification obtained by Pix4D in short, grassy terrain surrounding the car park (see Figure 1). In contrast, PhotoScan outperformed Pix4D in point density for the oblique-perspective house survey with 26% more points and 96.6% higher than OpenDroneMap.
Standard deviations
The standard deviations of the X and Y coordinates were all relatively close to each other, showing that there is not much horizontal variability between the point clouds. The marsh survey resulted in Agisoft PhotoScan and Pix4D having very similar mean vertical coordinates, with average separation of only 8 centimetres, while OpenDroneMap placed its point cloud over 65 metres above the other two. When relying only on the GPS onboard the UAS, one can expect to see large differences between point clouds along the Z axis. Similarly, the beach and jetties survey reveals a large vertical separation between Pix4D and the other two packages by an average of 15.65 metres. For the car park survey, ground control targets were utilised for absolute accuracy assessment. From this survey, Agisoft PhotoScan had a mean Z value of 1.53 metres, Pix4D had a mean Z value of 1.54 metres and OpenDroneMap had a mean Z value of 1.47 metres. This resulted in a range of 0.07 metres between the three, and only a 1-centimetre difference in mean Z values between PhotoScan and Pix4D (Z here is based on North American Vertical Datum 88).
The statistics uncovered some interesting facts about the house survey, which used higher image overlap (90%) and lower altitude (20m) relative to the other surveys. Interestingly, the mean Z values were 168.03 metres for Agisoft PhotoScan, 167.79 metres for Pix4D and 168.86 metres for OpenDroneMap, giving a range of 1.07 metres between the three. Considering the extreme differences along the Z axis seen in the other surveys without ground control, this is surprisingly low. A higher image overlap and higher image resolution, along with oblique perspective imagery, probably aided each software package in more uniformly resolving points within the X, Y and Z coordinate space; since this would likely result in a higher number of images per matched keypoint during the initial processing, it would help better solve the location of points and camera exterior orientation across all three software packages. Scene texture of the built environment could also play a part.
Open source
Pix4D created the point cloud with the highest density for four out of five surveys. The point clouds produced by Agisoft PhotoScan were found to be less dense and have fewer points than those in Pix4D’s results, except for the oblique-perspective house survey. Nevertheless, the average point spacing of the point clouds was 0.016 metre, with the closest spacing being 0.01 metre and the furthest being 0.02 metre. This demonstrates the understanding that even though PhotoScan produced a less dense point cloud than Pix4D, it maintained a very close point spacing. OpenDroneMap is an open-source project which means two things need to be considered. Firstly, this is an ongoing project where people voluntarily contribute to the improvement of the software. As time goes on, assuming that people continue to aid in the development, OpenDroneMap should become more proficient, more accurate and more user friendly. Secondly, OpenDroneMap is free to use. Having a software package that is capable of producing point cloud data and orthomosaic images at no cost to the user is not something to be taken lightly.
Concluding remarks
Each software package provides a more or less robust set of processing parameters that can be tuned for a specific project. Inherent differences between the processing parameters utilised across the software are responsible to a degree for the differences observed in this study. While this work aimed to minimise the influence that differing parameters had on the results, some differences are unavoidable. Iterating through different sets of parameters for each software package could likely have resulted in different or better results for each of these surveys. This, however, was not the intent of the work. Rather, this study aimed to compare SfM software solutions in order to gain a greater understanding of UAS-SfM point cloud uncertainty over different types of terrain. Furthermore, this work in no way attempts to endorse or recommend one software package over the others. The results are reported as is, with the caveats as above. In fact, the authors are avid users of each software solution examined here. Finally, the important take-home point is that point cloud quality of UAS-SfM software solutions is driven by many factors, of which one is terrain.
|
Density (ppm²) |
Spacing (m) |
No. of Points |
||
|
Marsh |
3,415.32 |
0.02 |
181,954,551 |
Agisoft Photoscan |
|
3,770.58 |
0.02 |
196,394,900 |
Pix4D |
|
|
55.884 |
0.13 |
1,935,784 |
OpenDroneMap |
|
|
Beach/Jetties |
2,979.84 |
0.02 |
118,840,450 |
Agisoft Photoscan |
|
3,598.25 |
0.02 |
140,769,094 |
Pix4D |
|
|
42.38 |
0.14 |
1,132,233 |
OpenDroneMap |
|
|
Forested Peninsula |
1,692.77 |
0.02 |
22,378,076 |
Agisoft Photoscan |
|
2,386.54 |
0.02 |
47,996,628 |
Pix4D |
|
|
2.374 |
0.27 |
60,861 |
OpenDroneMap |
|
|
Car Park |
7,886.18 |
0.01 |
70,960,767 |
Agisoft Photoscan |
|
9,151.22 |
0.01 |
83,510,589 |
Pix4D |
|
|
112.473 |
0.1 |
1,010,131 |
OpenDroneMap |
|
|
House |
5731.887 |
0.01 |
27,879,269 |
Agisoft Photoscan |
|
4271.339 |
0.02 |
20,638,333 |
Pix4D |
|
|
265.295 |
0.06 |
941,111 |
OpenDroneMap |
Table 1, Point cloud characteristics compared between the point clouds derived by three different SfM processing software packages.
|
Min X (m) |
Max X (m) |
Mean X (m) |
StdDev X (m) |
||
|
Marsh |
677,116.73 |
677,458.47 |
677,291.86 |
80.38 |
Agisoft Photoscan |
|
677,122.29 |
677,454.69 |
677,291.49 |
76.26 |
Pix4D |
|
|
677,163.96 |
677,439.48 |
677,301.40 |
62.06 |
OpenDroneMap |
|
|
Beach/Jetties |
680,750.48 |
681,064.21 |
680,878.25 |
61.15 |
Agisoft Photoscan |
|
680,767.11 |
681,062.60 |
680,879.92 |
60.17 |
Pix4D |
|
|
680,782.17 |
681,054.74 |
680,888.07 |
52.69 |
OpenDroneMap |
|
|
Forested Peninsula |
455,302.36 |
455,499.97 |
455,426.86 |
35.72 |
Agisoft Photoscan |
|
455,290.28 |
455,518.00 |
455,422.72 |
38.95 |
Pix4D |
|
|
455,146.70 |
455,454.55 |
455,381.14 |
40.67 |
OpenDroneMap |
|
|
Car Park |
675,653.78 |
675,763.31 |
675,710.51 |
23.71 |
Agisoft Photoscan |
|
675,651.44 |
675,763.37 |
675,710.14 |
24.27 |
Pix4D |
|
|
675,653.83 |
675,763.22 |
675,712.04 |
23 |
OpenDroneMap |
|
|
House |
669,097.70 |
669,182.19 |
669,138.46 |
18.6 |
Agisoft Photoscan |
|
669,098.74 |
669,180.85 |
669,137.88 |
14.38 |
Pix4D |
|
|
669,102.68 |
669,173.11 |
669,137.99 |
13.89 |
OpenDroneMap |
Table 2, A comparison of the minimum, maximum, mean and standard deviation of the X coordinate between the point clouds derived by the three different SfM processing software packages.
|
Min Y (m) |
Max Y (m) |
Mean Y (m) |
StdDev Y (m) |
||
|
Marsh |
3,058,487.82 |
3,058,757.35 |
3,058,620.17 |
56.12 |
Agisoft Photoscan |
|
3,058,497.28 |
3,058,751.74 |
3,058,624.69 |
53.39 |
Pix4D |
|
|
3,058,511.36 |
3,058,735.34 |
3,058,614.06 |
49.62 |
OpenDroneMap |
|
|
Beach/Jetties |
3,062,623.20 |
3,062,905.64 |
3,062,762.08 |
58.5 |
Agisoft Photoscan |
|
3,062,626.30 |
3,062,900.29 |
3,062,762.42 |
57.18 |
Pix4D |
|
|
3,062,627.88 |
3,062,863.34 |
3,062,768.85 |
44.8 |
OpenDroneMap |
|
|
Forested Peninsula |
3,685,333.51 |
3,685,528.40 |
3,685,453.74 |
41.7 |
Agisoft Photoscan |
|
3,685,304.60 |
3,685,545.13 |
3,685,438.85 |
44.22 |
Pix4D |
|
|
3,685,245.03 |
3,685,488.61 |
3,685,425.53 |
41.51 |
OpenDroneMap |
|
|
Car Park |
3,052,731.89 |
3,052,870.73 |
3,052,795.90 |
35.8 |
Agisoft Photoscan |
|
3,052,731.89 |
3,052,870.81 |
3,052,795.58 |
35.98 |
Pix4D |
|
|
3,052,731.89 |
3,052,870.52 |
3,052,794.68 |
34.73 |
OpenDroneMap |
|
|
House |
3,694,415.51 |
3,694,490.50 |
3,694,453.95 |
17.55 |
Agisoft Photoscan |
|
3,694,417.14 |
3,694,490.49 |
3,694,452.96 |
14.17 |
Pix4D |
|
|
3,694,421.02 |
3,694,487.42 |
3,694,453.94 |
13.57 |
OpenDroneMap |
Table 3, A comparison of the minimum, maximum, mean and standard deviation of the Y coordinate between the point clouds derived by the three different SfM processing software packages.
|
Min Z (m) |
Max Z (m) |
Mean Z (m) |
StdDev Z (m) |
||
|
Marsh |
-76.88 |
-63.48 |
-71.45 |
0.77 |
Agisoft Photoscan |
|
-72.46 |
-66.1 |
-69.96 |
1.15 |
Pix4D |
|
|
-9.7 |
-3.73 |
-6.09 |
1 |
OpenDroneMap |
|
|
Beach/Jetties |
-46.16 |
-28.14 |
-38.03 |
1.24 |
Agisoft Photoscan |
|
-78.27 |
-42.33 |
-47.31 |
1.66 |
Pix4D |
|
|
-39.62 |
-33.05 |
-36.15 |
0.85 |
OpenDroneMap |
|
|
Forested Peninsula |
55.15 |
120.44 |
83.95 |
11.25 |
Agisoft Photoscan |
|
46.29 |
96.36 |
73.77 |
6.98 |
Pix4D |
|
|
-211.11 |
85.81 |
46.65 |
49.51 |
OpenDroneMap |
|
|
Car Park |
1.11 |
1.76 |
1.53 |
0.09 |
Agisoft Photoscan |
|
0.66 |
1.83 |
1.54 |
0.09 |
Pix4D |
|
|
1.18 |
1.84 |
1.47 |
0.11 |
OpenDroneMap |
|
|
House |
161.24 |
177.24 |
168.03 |
1.86 |
Agisoft Photoscan |
|
164.11 |
177.54 |
167.79 |
2.02 |
Pix4D |
|
|
166.09 |
176.01 |
168.86 |
2.14 |
OpenDroneMap |
Table 4, A comparison of the minimum, maximum, mean and standard deviation of the Z coordinate between the point clouds derived by the three different SfM processing software packages.

Value staying current with geomatics?
Stay on the map with our expertly curated newsletters.
We provide educational insights, industry updates, and inspiring stories to help you learn, grow, and reach your full potential in your field. Don't miss out - subscribe today and ensure you're always informed, educated, and inspired.
Choose your newsletter(s)


